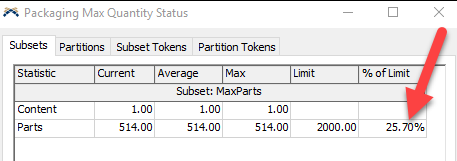
I am attempting to plot over time the "% of Limit" zone subset value. I'm having trouble adding it to a plot as I can't find the treenode that contains the value and there also doesn't seem to be an option to plot that from the pre-built zone plots. See the attached screenshot for an example of the value I'm looking to plot.percent-of-limit.png
The only way to plot that value without digging deep in the tree is to make the limit a global table value. You can use that table value as the limit in the Zone. Then you can make a custom Statistics Collector that calculated the % of limit, by dividing the current by the limit in the table. This way, both places reference the same number. It may be easiest to start with a Zone Template and then install/modify it.
8 People are following this question.
