Hi @jordan.johnson, please we need to assemble one graphic showing the resources (RNs/MDs) states during different periods of the day (time). Is it possible to get it in Statistic Collector.
Is it possible to get a dashboard showing RNs/MDs states versus time of day?
FlexSim 19.1.0
Is this what you want?
To make this chart I made a Process Flow, a Statistics Collector, a Calculated Table, and a bar chart.
The Process Flow creates a token that listens to the On State Change of each Staff object in the model. Whenever the state changes, the token sets its own state profile (a categorical Tracked Variable label that tracks the profile) to the same state. In this way, you get a state profile that only remembers the previous hour. Each hour, that token is destroyed, and a new token appears.
The Statistics Collector listens to when those tokens are created and destroyed. When they are created, the collector creates one row per token and per state in the People Settings object. Each row records the time the row was added, the object for the row, and the state for that row. Each row also records the percentage of time that the token's state profile has been in a particular state, as a percentage. Finally, the row records the utilization, again referring to the People Settings object to determine which states count and which do not. When tokens are destroyed, the Statistics Collector freezes the values (by using the "Stop Tracking Row Value" option).
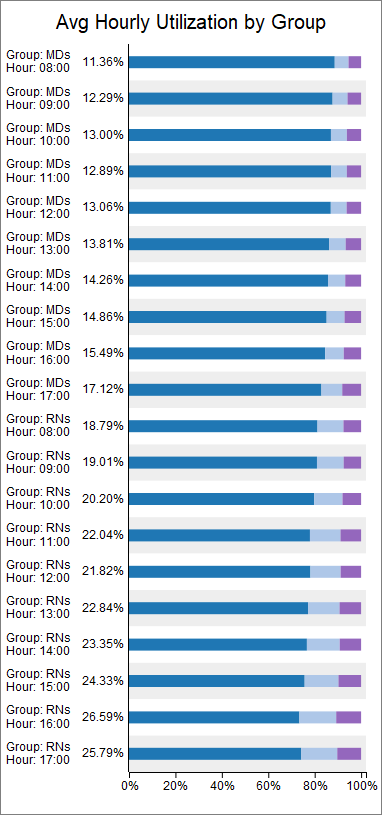
The Calculated Table uses the Query Builder to average the time in each state and the utilization. The average is calculated per group, per hour of day.
The approach shown in this model should work in any People/Healthcare model without modification. You should be able to copy/paste the process flow and the statistics collector in the tree into another model. You will probably have to remake the Calculated Table in your own model.
Let me know if you have questions, or if this doesn't work for some reason.
10 People are following this question.