question

Beatriz BV avatar image
0 Likes"
Beatriz BV asked Beatriz BV commented

Obtener gráficas específicas

hola,

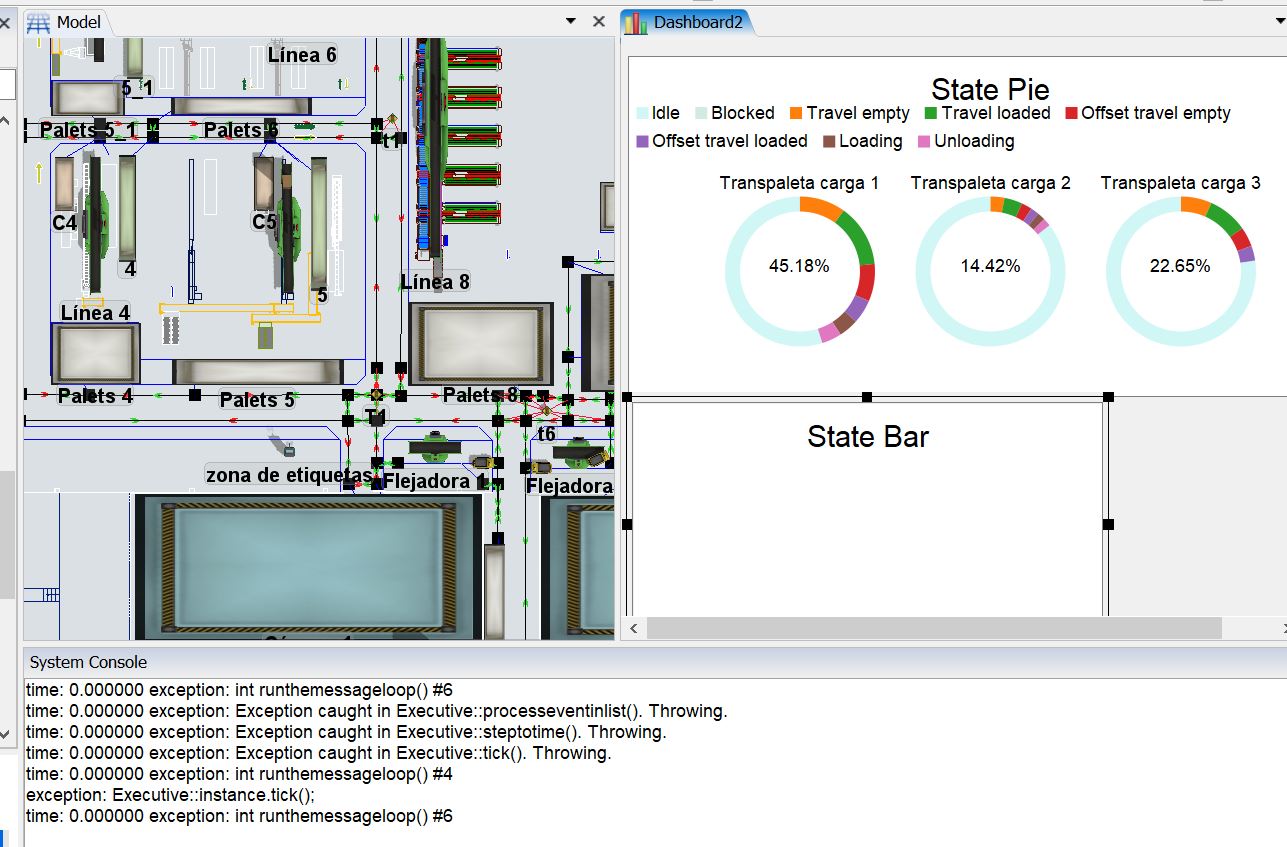
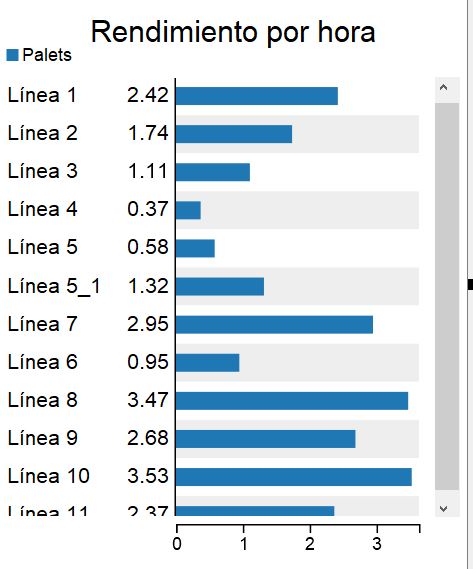
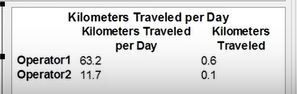
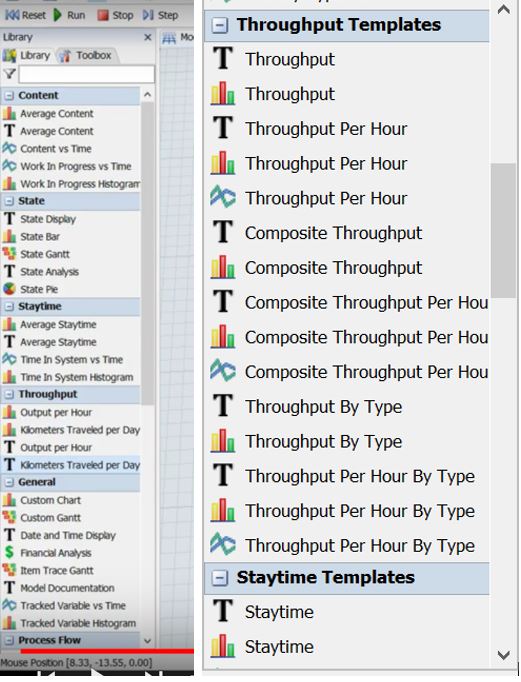
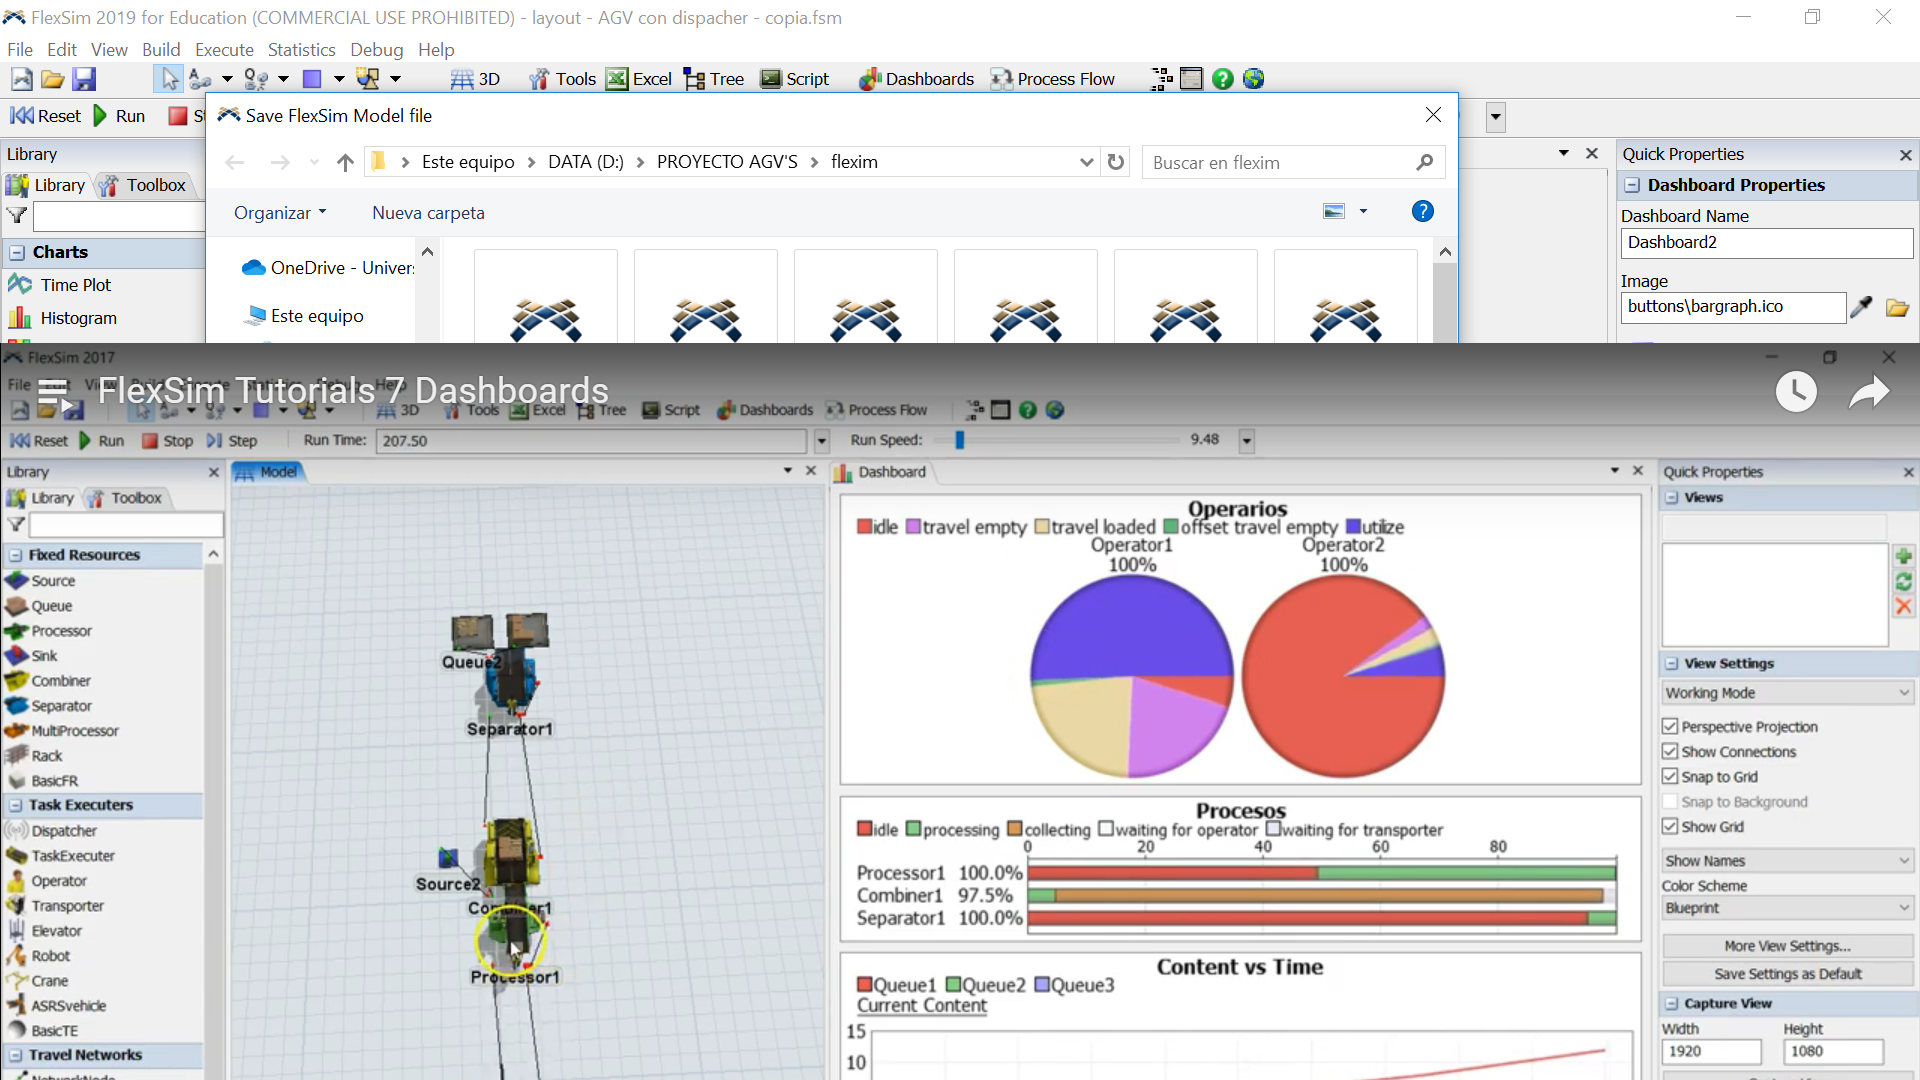
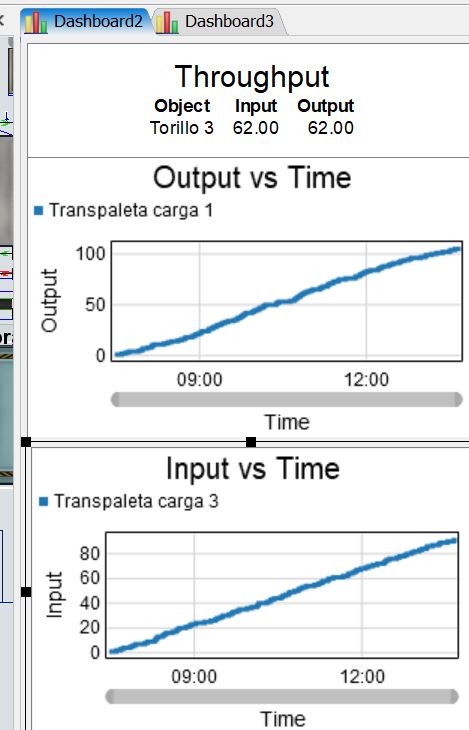
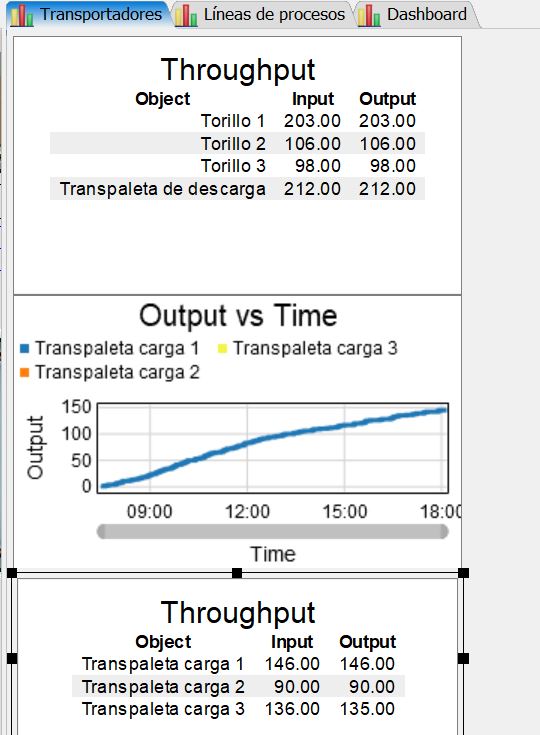
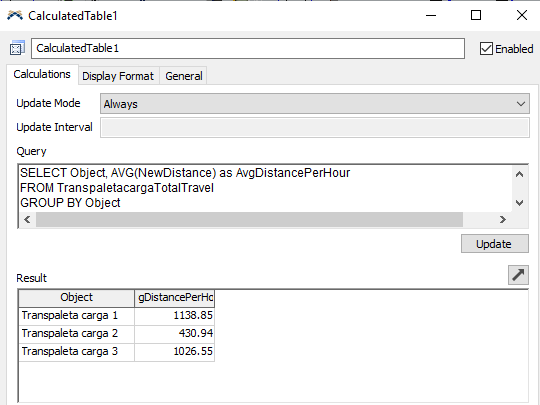
me gustaría obtener gráficas relacionadas con las colas, con los procesos por ejemplo las unidades que salen por hora y de los vehículos como los kilómetros que recorren o su actividad de trabajo.

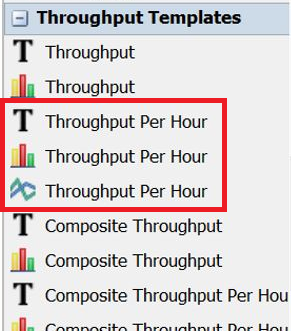
he visto un tutorial (imagen izquierda), pero mi versión (imagen derecha) no me da la mismas opciones. ¿Cómo puedo obtenerlas?

captura.jpg

tutorial.png

FlexSim 19.0.2
graficos
tutorial.png (1.0 MiB)
captura.jpg (80.6 KiB)
· 1
5 |100000

Up to 12 attachments (including images) can be used with a maximum of 23.8 MiB each and 47.7 MiB total.

1 Answer

tannerp avatar image
0 Likes"
tannerp answered Beatriz BV commented

To answer your question, the options are different because the version in the tutorial is FlexSim 2017 and you are using FlexSim 2019. There are changes and updates in the new version.

You can still achieve the data you want, but the name or appearance may not be the same. Por ejemplo, "las unidades que salen por hora" se llaman "Throughput per Hour".

It appears that you're trying to get statistics for the "Transpaleta carga 1,2,3". You can click on a "Transpaleta carga" object, go to Quick Properties -> Statistics and then click the pin next to "Throughput" to pin one of these directly to a dashboard.

Let me know if this helps!


· 8
5 |100000

Up to 12 attachments (including images) can be used with a maximum of 23.8 MiB each and 47.7 MiB total.