question

David Seo avatar image
1 Like"
David Seo asked Jordan Johnson commented

Output per Hour of DP and the consistency of statistics

I can't understand why the usage of statistics become harder according to the upgrade version. And the consistency of them is lost.

The Output Per Hour of DP can't be displayed in Dashboard. I found it is possible using Conveyor statistics.

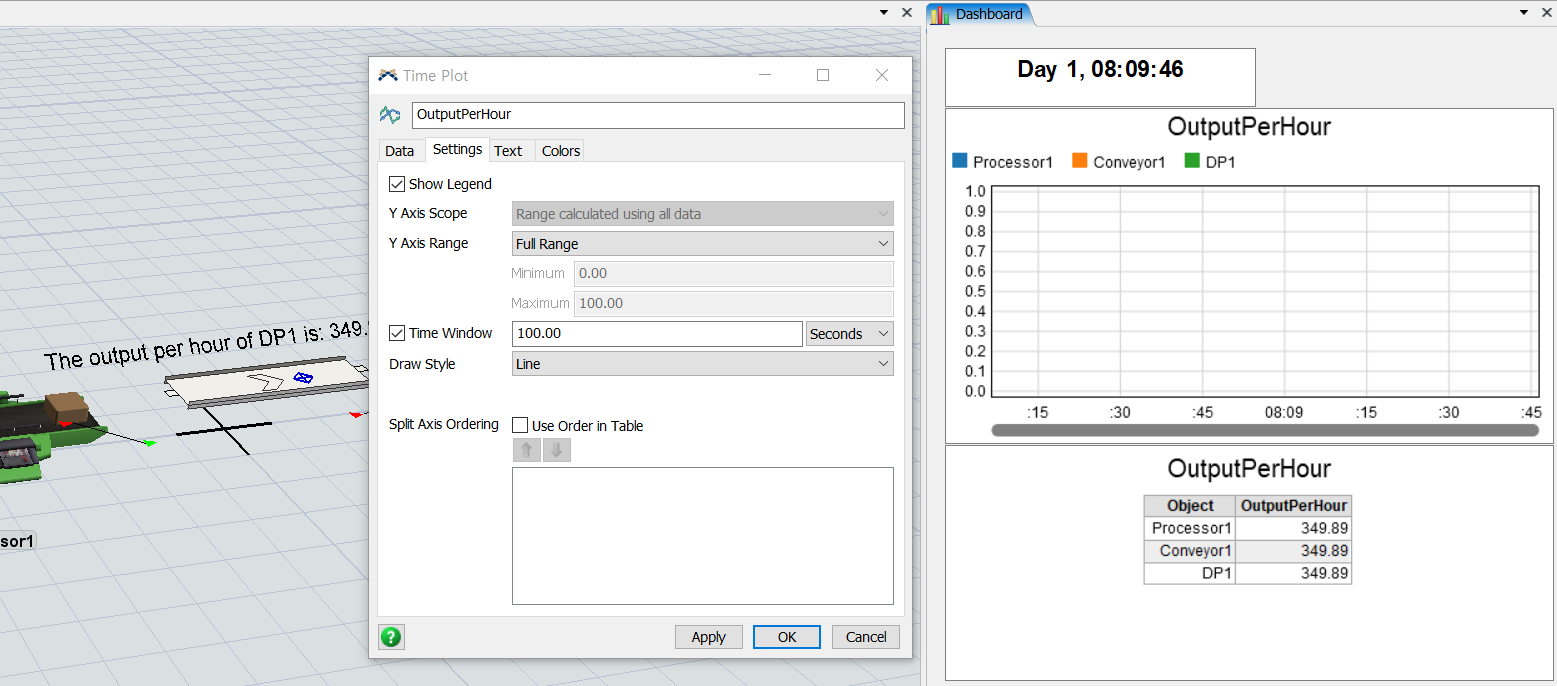
But the output per hour of DP is possible when using Visual Text object on 3D model. Why it is displayed in a place but it is impossible in another place?

DP output per hour on Dashboard is possible in 2017 (legacy dashboard) but it not possible in the latest version. Statistics display setting become harder and harder for flexsim beginning user.

conveyor-vs-dp-output-per-hour.fsm

FlexSim 19.2.4
statistics display for flexsim beginer.
5 |100000

Up to 12 attachments (including images) can be used with a maximum of 23.8 MiB each and 47.7 MiB total.

1 Answer

·
Jordan Johnson avatar image
3 Likes"
Jordan Johnson answered Jordan Johnson commented

This is a bug. Most of the templates are currently only compatible with objects that use OnEntry/OnExit events, which includes all fixed resources and process flow activities. We want to improve them to allow objects with OnLoad/OnUnload and OnArrival/OnContinue (any any other entry/exit-like event pair). This issue is on the list.

The attached model shows how to make Output per Hour chart, either vs time, or as a bar chart. It will work for any object that has an Output stat, as long as you put it in the group called OutputObjects: conveyor-vs-dp-output-per-hour-modified.fsm


· 2
5 |100000

Up to 12 attachments (including images) can be used with a maximum of 23.8 MiB each and 47.7 MiB total.

David Seo avatar image David Seo commented ·

@jordan.johnson

Thank you for your kind explanation.

I think using Dashboard statistics should be simpler or not user's setting.

FlexSim 2016 version is very intuitive and the most simple using it through flexsim upgrade. Is it impossible to come back then?

In my opinion, I think statistics collectors should be background features hidden (user not setting). Users know well statistics to need data gathering but they do not want to set the data collecting complicately. Statistics Collecting feature should be flexsim's doing background not user or modeler working.

If it needs some setting, it should be same with 2016 update 2 version feature.

The current Statistics Collector is the most difficult when using FlexSim, I think. It is belongs only to me?

I hope Dashboard will be the most favorite feature for the user in the next version.

And your model does not show anything in the trend line chart like below. What's the problem of it?

Thank you.

0 Likes 0 ·
Jordan Johnson avatar image Jordan Johnson ♦♦ David Seo commented ·

The problem is that it hasn't run for 2 hours. The output per hour vs time chart measures the output every hour. So to get two data points, you need to run for two hours.

0 Likes 0 ·

Write an Answer

Hint: Notify or tag a user in this post by typing @username.

Up to 12 attachments (including images) can be used with a maximum of 23.8 MiB each and 47.7 MiB total.