question

Wang L3 avatar image
0 Likes"
Wang L3 asked Jordan Johnson answered

How to get group resource utilization over a time interval

Hi Flexsim Coummnity,

I would like to seek help in getting the average group resource utilization over a time interval.

I currently have a process-3d hybrid model which is to simulate three car parks in our hospital. I used custom code in process flow and manage to set performance measure to track average group resource utilization (as shown in the screenshot below). As ar parks open 24 hours in a day, this model has repeated daily arrivals from 0:00am to 11:59pm.performance-measure-table.png

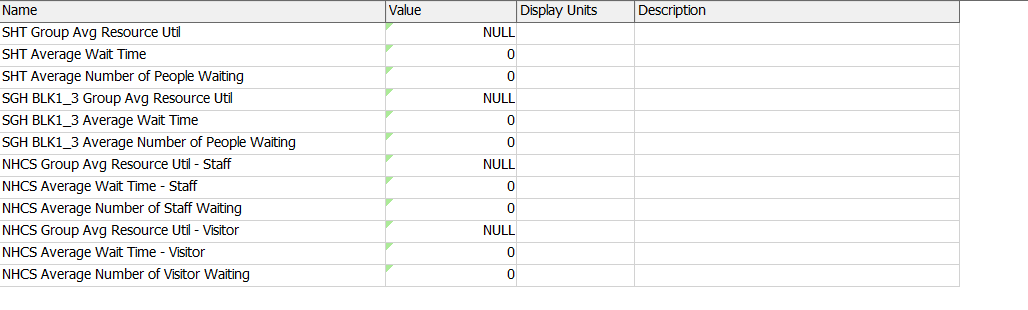
I plan to run model for 7 days (i.e. warm up priod = 7 days) to a steady state, then collect model output on the next 7 days. What I can get from these runs will include the daily average group resource utilisation (over 24 hours).

Since car arrvial rates are quite different from day time (defination of day time: 6am to 6pm) to night time, I am more interested to find out the group utilization rate at day time.

May I know anyone has some ideas on how to do this?

Attached my model. Thank you very much!

Car Park Simulation Model_complete_v1.fsm!

FlexSim 21.0.0
time intervalgroup utilization
5 |100000

Up to 12 attachments (including images) can be used with a maximum of 23.8 MiB each and 47.7 MiB total.

Jordan Johnson avatar image
0 Likes"
Jordan Johnson answered

Here's what I'm understanding from your question:

  • You have some objects that are highly utilized during the day (6am to 6pm), and they have low utilization at night.
  • Those objects are in a group.
  • You want to calculate average utilization after 7 days
  • If you calculate utilization normally, the value is too small, because it includes night time, and you want to focus on utilization during the day.

The following answer assumes all the above points are true.

The easiest way I can think of would be to set your objects to an excluded state at night. You could create a process flow that does the following:

  1. Scheduled source creates one token per object
  2. Those tokens go into the following loop:
  3. Wait for event - listens to the state change of that object
  4. Use a Decide: if during the day, do nothing
  5. If the state changes at night: use a zero-time delay, then set the state of the object to an excluded state
  6. Whether night or day, go back to listening for a state change.

Doing this will force your objects into an excluded state at night, and your statistics should naturally exclude the day time.

5 |100000

Up to 12 attachments (including images) can be used with a maximum of 23.8 MiB each and 47.7 MiB total.

Joerg Vogel avatar image
0 Likes"
Joerg Vogel answered Wang L3 commented

Maybe you can start with data collecting tutorial 2.9. It is collecting the output per hour, but I think you can shrink the data in a calculated table to daytime values.

· 1
5 |100000

Up to 12 attachments (including images) can be used with a maximum of 23.8 MiB each and 47.7 MiB total.

Wang L3 avatar image Wang L3 commented ·
Hi Joerg, I am not sure if this is the answer that I am looking for.

I read this statistics collection tutorial before.

However, what I am thinking to get, is a single value which is the daily average utilisation from 6am to 6pm, not a chart, and not a series of value by hour. Collecting hourly value does not make sense to me, as it loses information on the utilisation on other timings. What I meant is, for example, how about utilisation at 6:30am, 7:05am and so on.

For your further advise please. Thank you.


0 Likes 0 ·

Write an Answer

Hint: Notify or tag a user in this post by typing @username.

Up to 12 attachments (including images) can be used with a maximum of 23.8 MiB each and 47.7 MiB total.