question

Filippo C5 avatar image
0 Likes"
Filippo C5 asked Jason Lightfoot edited

Why don't the Content vs Time stats of a list work?

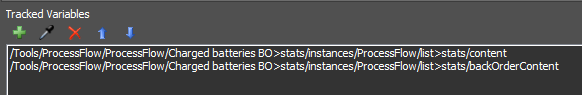
I have created this model (which I have attached) and I need to obtain the statistics of the contents of the two lists "Charged batteries BO" and "Low batteries BO" and of the Delay block, in addition to the back orders in input of the list "Charged batteries BO" . (see photo 1).

immagine-2022-03-01-153614.png

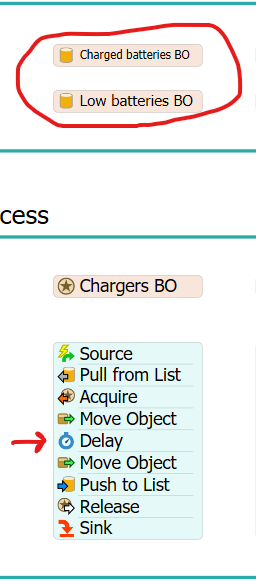
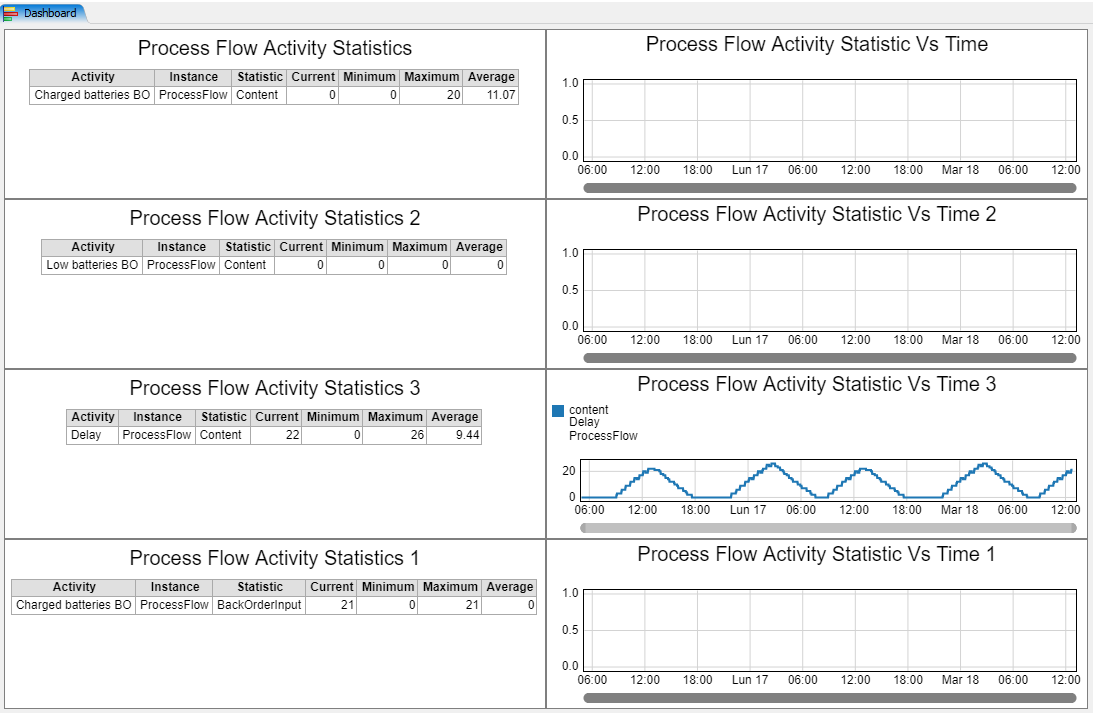
The statistics in table form work, but the Content vs Time statistics regarding the lists show nothing (see photo 2).

immagine-2022-03-01-154223.pngtruck-example-1 - Label onboard ciclo.fsm

Why?

Thanks in advance

FlexSim 22.0.0
liststatisticsstatistic collectorstatistic
5 |100000

Up to 12 attachments (including images) can be used with a maximum of 23.8 MiB each and 47.7 MiB total.

1 Answer

·
Jordan Johnson avatar image
1 Like"
Jordan Johnson answered Jason Lightfoot edited

This is a bug, which I'll add to the dev list.

To work around it for now, you can actually use the Content line graph from the Content section of the library. This works because the activity is in a general flow.

· 2
5 |100000

Up to 12 attachments (including images) can be used with a maximum of 23.8 MiB each and 47.7 MiB total.

Filippo C5 avatar image Filippo C5 commented ·
Ok, thank you for the answer.

But in the library I found the line graph for the content of the list but not for the back orders. Is there somewere in the library this kind of statistic graph or not?

0 Likes 0 ·
Jason Lightfoot avatar image Jason Lightfoot ♦ Filippo C5 commented ·

You can show content and backorders on the same graph if you use a tracked variable chart (under "General"), and point it to these nodes:

1646230679595.png


truck-example-1-label-onboard-ciclo_jl.fsm

0 Likes 0 ·

Write an Answer

Hint: Notify or tag a user in this post by typing @username.

Up to 12 attachments (including images) can be used with a maximum of 23.8 MiB each and 47.7 MiB total.