question

Cameron Pluim avatar image
3 Likes"
Cameron Pluim asked Adrian Haws edited

How do I display statistics for partitions within a zone?

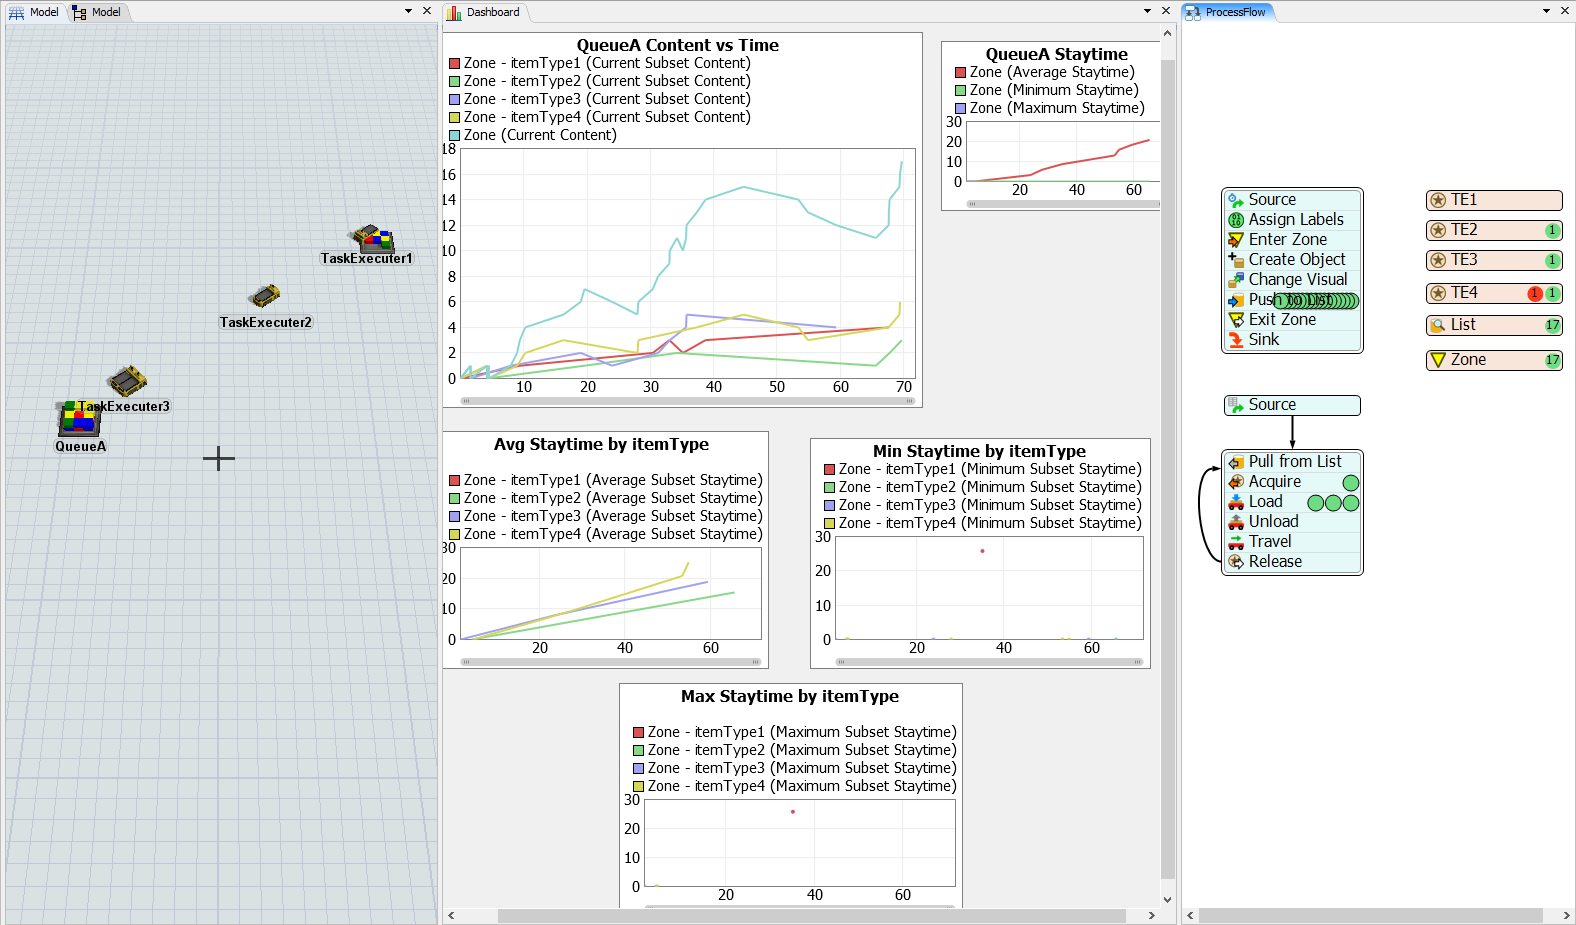
Assume I have Queues A,B,C,D and TEs 1,2,3,4. I can have product arrive at any queue and require any specific TE to transport it.

I'm trying to have a zone collect the following statistics: Content Vs Time (Per Queue, and Per Queue and TE), Min/Max/Average Staytime (Per Queue, and Per Queue and TE).

So lets say Queue A has 4 products, 1 needs TE 1, 2 need TE 3, and 1 needs TE 4. I would need:

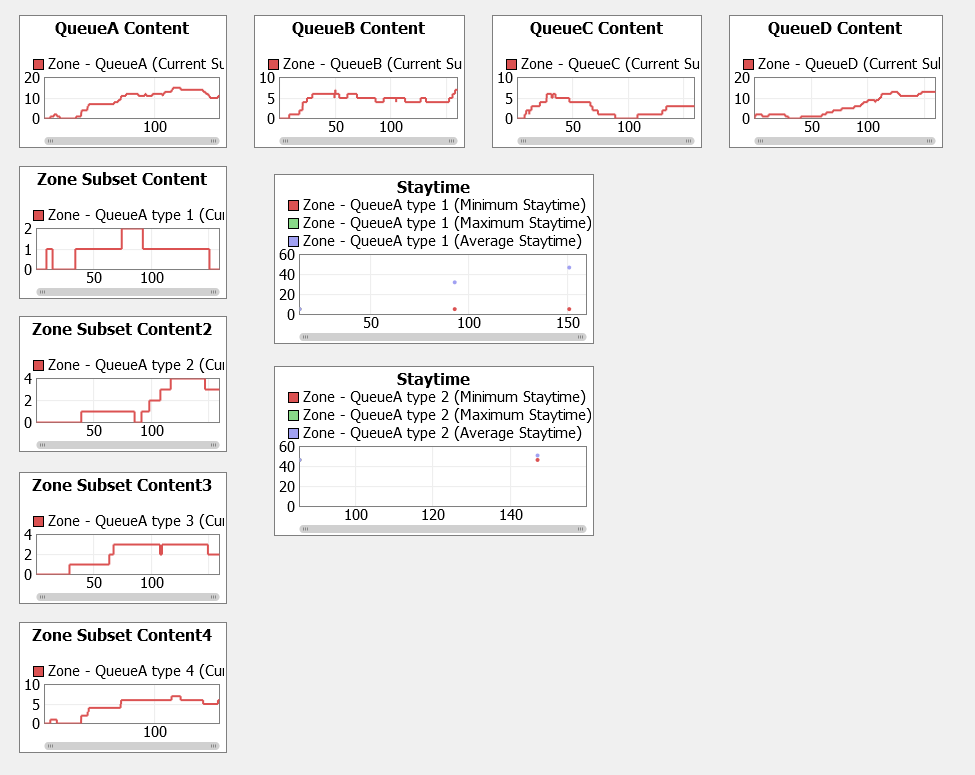
  • Content Vs Time (Queue A)
    • Content Vs Time (Queue A TE 1)
    • Content Vs Time (Queue A TE 3)
    • Content Vs Time (Queue A TE 4)
  • Min/Max/Average Staytime (Queue A)
    • Min/Max/Average Staytime (Queue A TE 1)
    • Min/Max/Average Staytime (Queue A TE 3)
    • Min/Max/Average Staytime (Queue A TE 4)

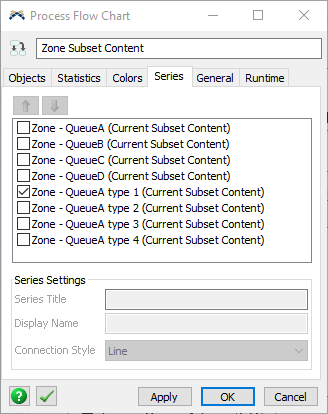
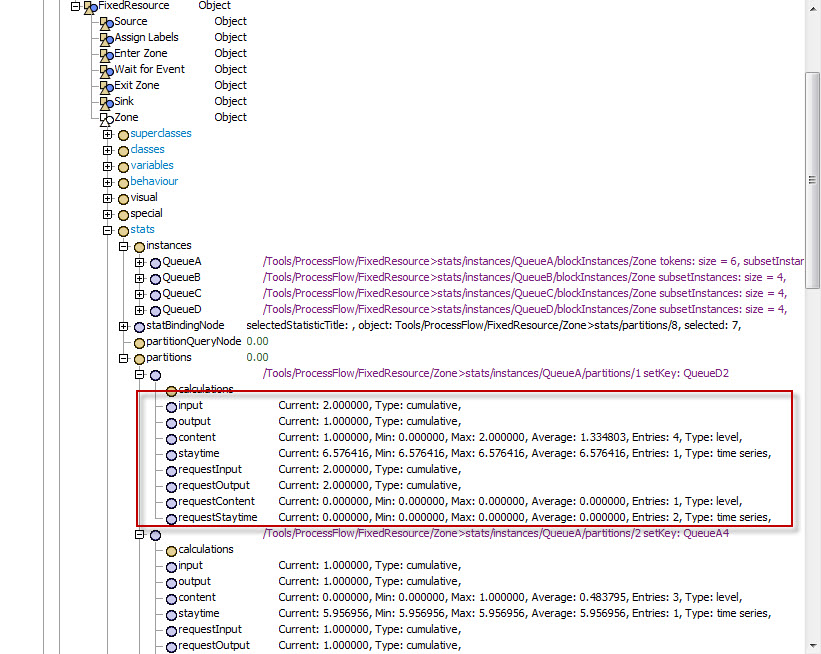
Currently in my model I have a fixed resource process flow that is just gathering the statistics for these queues, where they enter a global zone which separates them into subsets based on queue, and partitions based on queue&TE. This is the best way I found to do it so I only have to create subsets for the number of Queues I have in the model, and not for each QueueTE interaction, but I've found that the dashboard statistics don't have a clear way of showing the partition statistics like they do the subset statistics.

Is there a good way to display these Zone Partition statistics, or is there a better way to collect these statistics?

FlexSim 16.1.0
statisticszonepartitions
5 |100000

Up to 12 attachments (including images) can be used with a maximum of 23.8 MiB each and 47.7 MiB total.

Adrian Haws avatar image
1 Like"
Adrian Haws answered Cameron Pluim commented

After looking at your model I was able to find a way to generate these charts without using zone partitions or exporting raw data. For now it's not quite as convenient as using the partitions, but you can simply create more subsets specifying each combination.

I've attached a revision of your sample model below. You'll see that there are charts for the content of each Queue, as well as the content of each type in QueueA. I also demonstrated the Minimum, Maximum, and Average Staytime for specific types in QueueA.

Here's an example of defining each label's value in "Token Selection Criteria" for each new subset:

Queue = "QueueA" AND TE = 4

Then in the "Series" tab for the chart properties you can only select the subset(s) that you need in order to display the data.

Here's how the charts look that I've set up so far:

If you still want to export the data after your model run let us know, but this is how you could avoid having to do that with your specific model.


· 1
5 |100000

Up to 12 attachments (including images) can be used with a maximum of 23.8 MiB each and 47.7 MiB total.

Adrian Haws avatar image
0 Likes"
Adrian Haws answered Adrian Haws edited

Hi Cameron,

Although you can display list partition statistics I'm not aware of an easy way to do so with zone partitions.

It would help to see how you have your model set up, but I created an example model that I hope works similarly to yours but on a smaller level (although I just used a general process flow). I created a label to represent the four different types of products and made a zone subset for each of these label values. The built-in zone statistics in the dashboard make it really easy to display things like Content vs Time and Staytime. For example, to display the average staytime for each type of product (I called it "itemType" in the example) you can drag a "Zone Calculation" chart into the dashboard and select the Zone as an object. Then in the Properties' "Statistics" tab you add "Staytime" within "Zone Subset Statistics," select it, and change the Value in the window from "Current" to "Average." This might be easier to see in the model I've attached.

If this doesn't answer your question feel free to let us know and we'll do our best to help you.


zone-stats.png (170.8 KiB)
· 3
5 |100000

Up to 12 attachments (including images) can be used with a maximum of 23.8 MiB each and 47.7 MiB total.