question

Jason Merschat avatar image
0 Likes"
Jason Merschat asked Sam Stubbs answered

Correct the Output Hour Time Series Graph

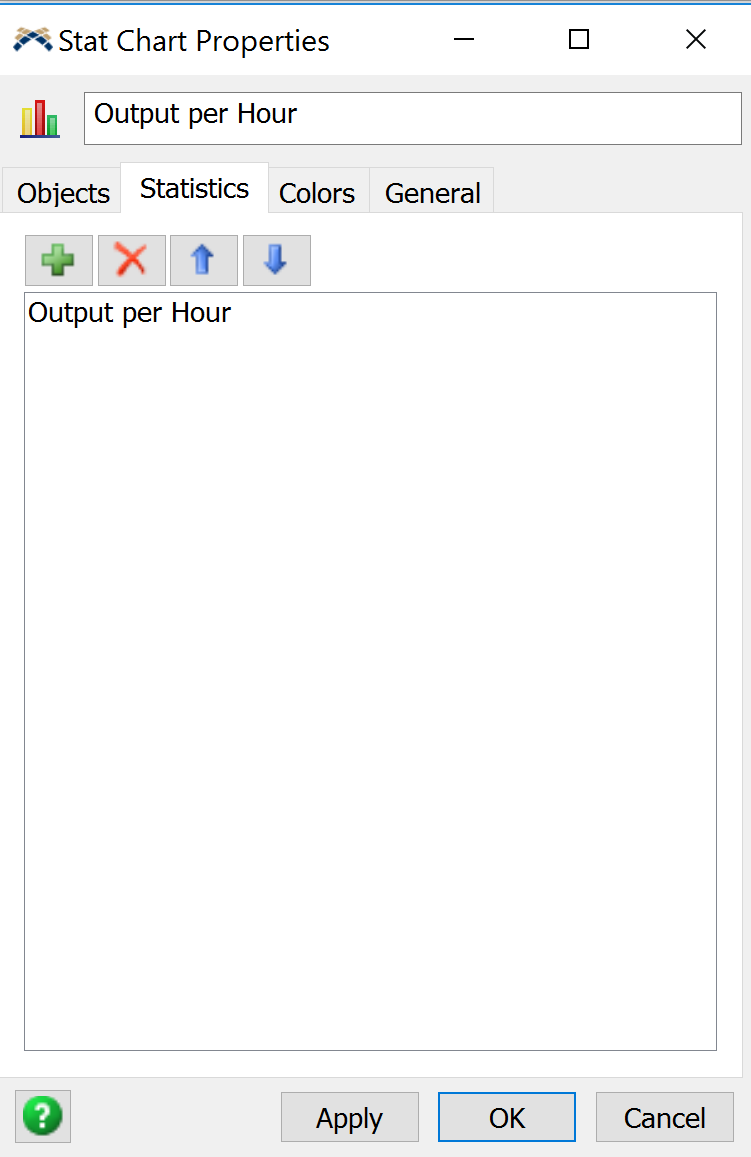
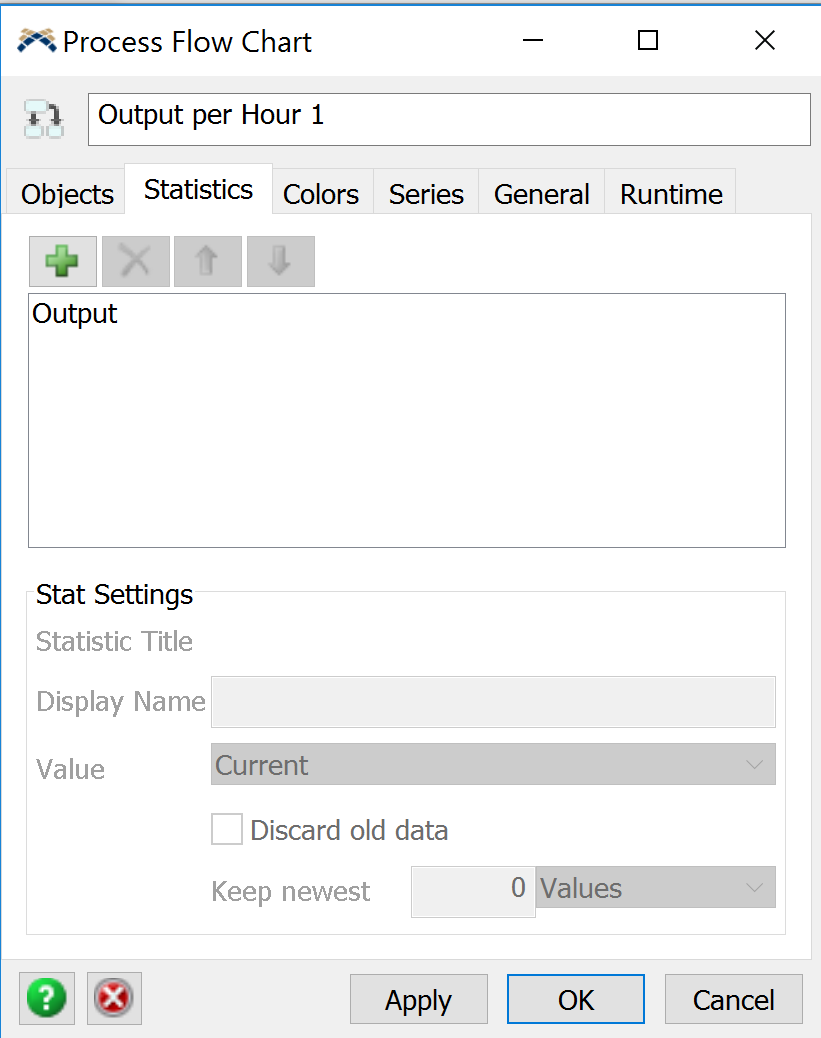
The Output Per Hour Time Series uses "Output" as the metric and shows cumulative output, whereas the Output per Hour Bar Graph uses "Output per Hour" and shows instantaneous hourly output. I believe the time series is using the wrong metric and should be corrected to use Output per Hour to show hourly output variation as opposed to Output vs. Time.

FlexSim 16.2.2
graph
ophbg.png (31.3 KiB)
ophts.png (42.0 KiB)
5 |100000

Up to 12 attachments (including images) can be used with a maximum of 23.8 MiB each and 47.7 MiB total.

1 Answer

·
Sam Stubbs avatar image
0 Likes"
Sam Stubbs answered

If you click on the Output statistic in the Process Flow Output Per Hour, you'll see that with the "Discard old data" box is checked by default, and that in the "Keep newest" field it is set to 1 hour. If you run your model for an hour in model time you should notice the graph gets then starts displaying the results of output with context of the last hour.

5 |100000

Up to 12 attachments (including images) can be used with a maximum of 23.8 MiB each and 47.7 MiB total.

Write an Answer

Hint: Notify or tag a user in this post by typing @username.

Up to 12 attachments (including images) can be used with a maximum of 23.8 MiB each and 47.7 MiB total.