The Statistics Collector is a powerful object. Its purpose is to record data about the model run as a table, and it is very effect at doing that. However, it is very abstract; being abstract allows it to be highly flexible, but makes it more difficult to learn. This article is meant to help you understand (or remember) how the Statistics Collector models the problem of converting model data from objects and events into a table of data.
This article compares a Statistics Collector to a train being loaded an unloaded. It is NOT an article about how to model a trainyard or other rail-industry systems. The purpose is to compare the Statistics Collector, which is very abstract, to something most people understand.
So we'll start by talking about the story of a simple freight train. This story has the following elements:
- Starting - the train starts its journey a the beginning of the line
- Loading Stops - the train makes several stops along the way to load goods
- Unload Planning - unlike a normal train, this train determines where it needs to go after this point based on what was loaded into the train
- Unloading Stops - the train makes several stops along the way to unload goods
This is a very simple story. Just keep the sequence in mind - the train starts, makes several load stops, figures out its destinations, and then makes several unload stops.
To see how this is like a Statistics Collector, take a look at this model:
StatsCollectorVisualization.fsm
This model is very simple. It consists of a Source, Queue, Processor, and a final Queue:
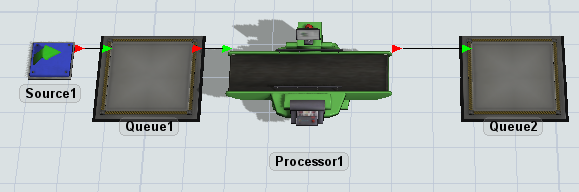
Items are generated at the Source and flow through the Model. Items have a Type label, so that there are three Types of items: Type 1, Type 2, and Type 3.
If you zoom out, you'll see a much bigger section of the model:
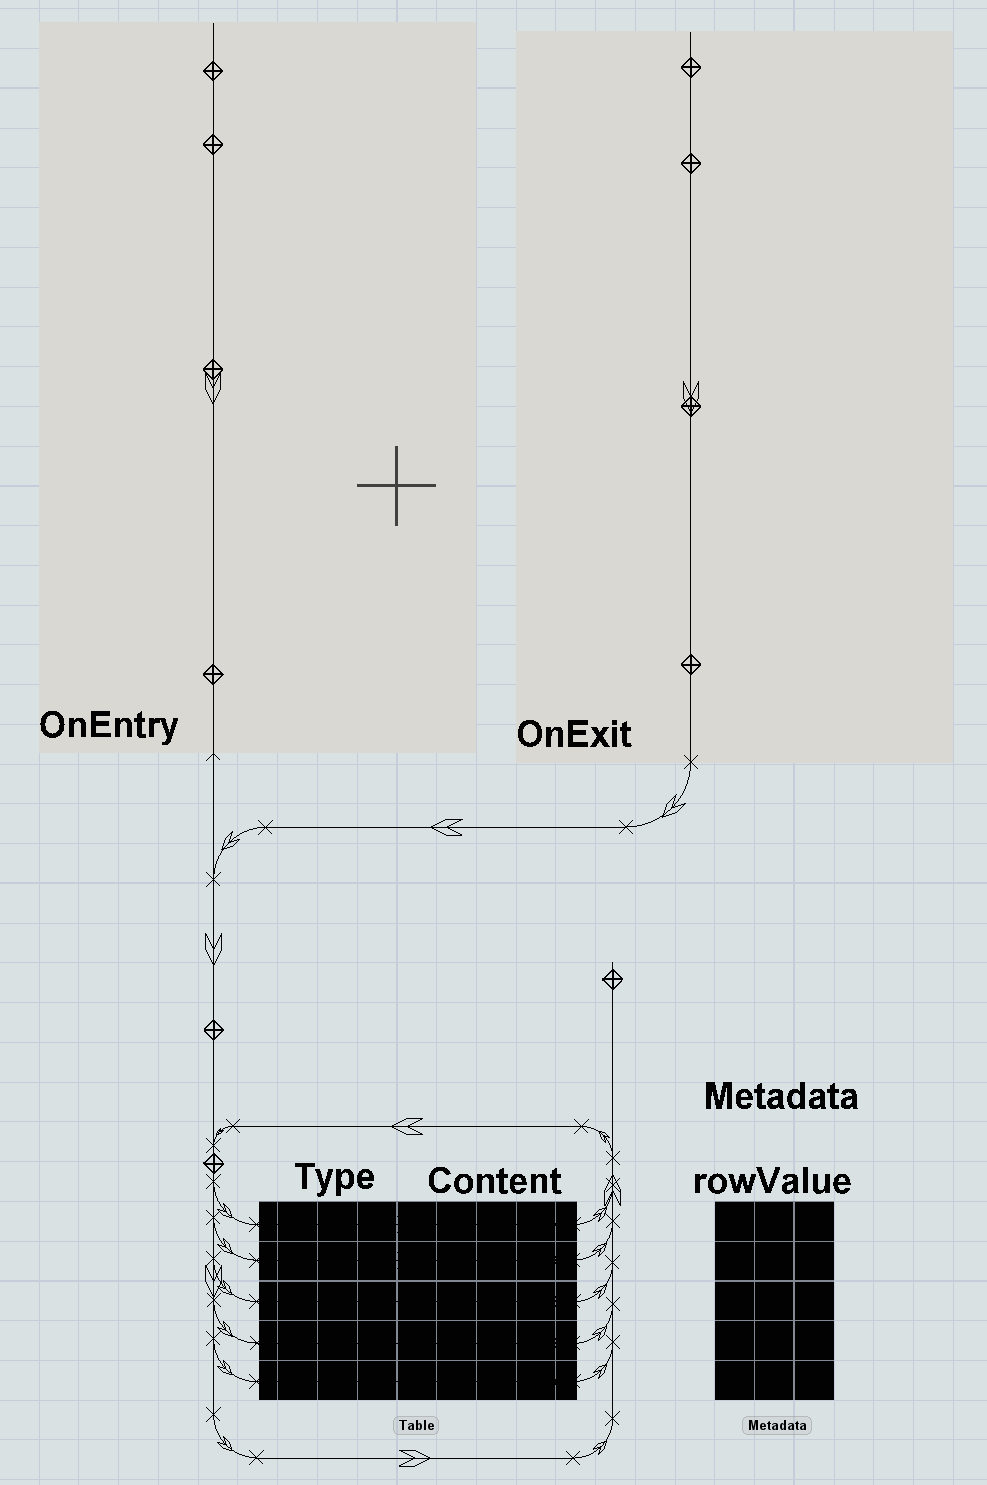
This section simulates the logic of a Statistics Collector. As the model runs, you'll see AGVs run along the track, like a train. You'll see them make several stops and pick up boxes. Then you'll see them stop at the "Table" (the bigger black box in the image above) and "unload" data into the table.
The Statistics Collector tool is a lot like this simulation. It has an internal "train", and you reference that train with the keyword data. When you use the Statistics Collector, you are configuring the journey of the train, which determines what data is recorded in your table.
Starting the Train
The statistics collector creates a train (the data object) when it observes an event. You configure which events a Statistics Collector cares about on the Events tab. You can listen to many different things, including:
- A flowitem enters or exits an object
- A token enters or exits an activity
- The model is reset
- The model gets to the warmup time
Whenever any of these things happen, the Statistics Collector creates a train (again, called data) and starts it going on its journey. In this example, the Statistics Collector listens for items to enter Queue1. It also listens for items to exit the processor. Either event will start a train.
Loading the Train
Once the train is going, the Statistics Collector "loads" the train with information. In reality, this happens by adding labels and setting values on data. First, data gets all the values associated with the event (the event parameters) assigned as labels. Then, data gets all the labels specified in the "Additional Labels" section. Finally, data visits the Row Value station. Here, the special property called rowValue is set.
Note that as you load the train, you can use anything already on the train to get more information loaded on train. In the example model, the row value is set to "data.item.Type"; data is the train, and the "item" label is already on board, so the row value field can use that to load additional information.
Unload Planning
The next stop for the train is something that you can't really see, but that is very important. The Statistics Collector inspects the row value on data. The Statistics Collector remembers all row values that it has ever inspected, and it adds a row to the table for each unique row value. This is where the row value got its name. If the Statistics Collector sees a value it has never seen before, it adds a row to the table, and associates the new row with the row value.
Once the row is either added or found, the Statistics Collector sets the property rowNum on data. So now, the train knows which row it is going to visit.
All that is left in this phase is to figure out which columns the train will visit. First of all, if the row was added, the train will visit all the columns to set their initial value, which is called the Row Add Value (the value to set when the row is added). Whether or not the row was added by the event, the train will also visit any columns that are connected to the event, setting the value to the Event Value (the value to set when a connected event happens).
So in summary, the Statistics Collector figures out which row the train will visit based on the row value, adding a row if necessary. If the row was added, then the train visits all columns in the row, to set the Row Add Value. If the event is connected to any columns, the train will also visit those columns, and set the Event Value.
Unloading the Train
Finally the train can unload data into the table. As it visits each cell, it unloads information into that cell. As the user, you configure what gets unloaded at each cell. You can unload anything into the cell, including anything on the train, anything connected to anything on the train, or anything globally accessible.
In reality, whenever the Row Value or Event Value is evaluated, you can access and labels or properties on data. You can also use values on data to access other values. Or you can access global values, such as the current model time, or a Global Variable, or a value in a Global Table. In the example model, the Event Value field accesses the value that is currently in the table at the cell being visited by data.
Does the statistics collector really have to travel?
In the visualization model, the data train takes up time on the clock to load, plan, and unload. However, for the true Statistics Collector, all of that happens in zero time. For example, when an item enters Queue1, the real statistics collector in the model finishes updating instantaneously. In contrast, the visualized statistics collector train is still moving to get more labels. This is for illustration purposes only.
What about "Update when accessed" columns?
All Statistics Collectors know when something is trying to read their values. For example, if you have a chart pointed at a Statistics Collector, and that chart repaints, it will read the Statistics Collector. Or if you access the table through FlexScript with code like Table("MyStatisticsCollector")[1][1], that will read the Statistics Collector also.
So in a way, it's just another event. However, there are two differences:
- You can't load custom labels on the train for this event; it "skips" those stops
- The train visits all rows in the table
When you set a column to update when the value is accessed, you are basically connecting it the "OnAccess" event.
So when the table is accessed, the data train visits all rows of the table. For each row, it gets the rowValue and rowNum properties set, and then it visits all the "update on access" columns.
What about other features?
This article just covers the basics, and doesn't cover other features of the Statistics Collector. Just know that there are many ways to configure the train's journey. For a full reference, see
https://docs.flexsim.com/en/21.0/Reference/Tools/StatisticsCollector/
However, all of the features discussed in the reference add more detail; you can just improve your mental image of how the Statistics Collector works.
