article

Jason Lightfoot avatar image
11 Likes"
Jason Lightfoot posted Jason Lightfoot commented

Heatmap Anything

heatmapanything2.gif


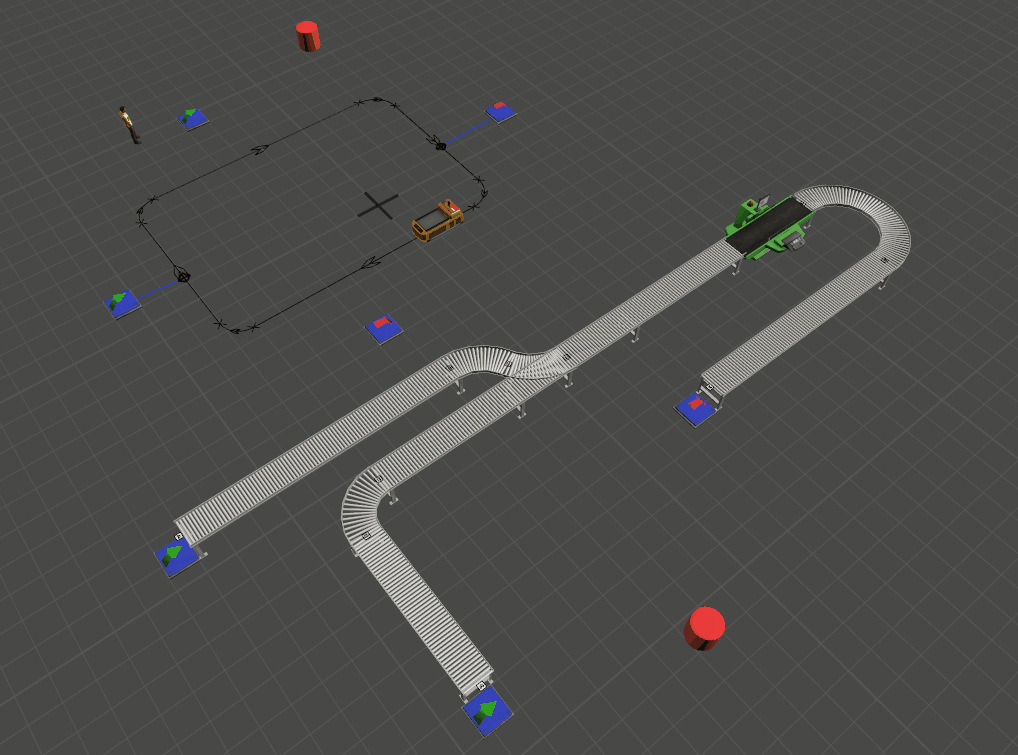
This model and library will allow you to produce a heat map of anything moving in the model - including AGVs and Flowitems.

To add this to a model is simply a matter of :

1) Load the attached user library

2) Add objects to the group HeatMapMembers

3) Drop a heat map object (cylinder) into the model - reset and run.

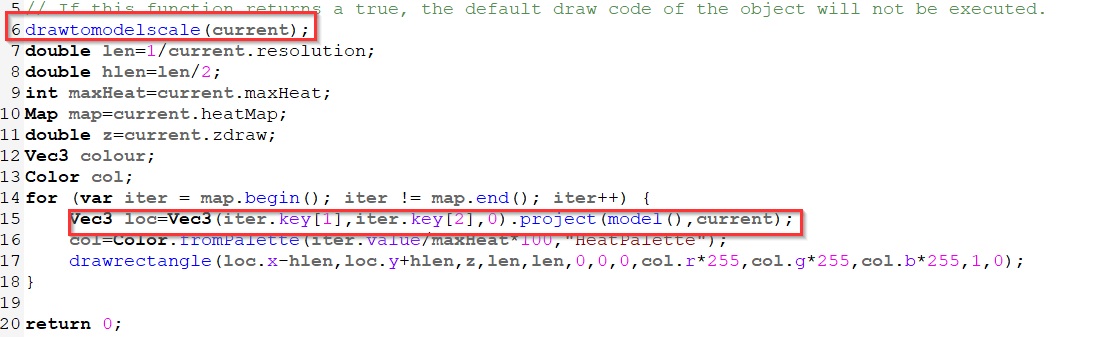
With this updated version you can now you can now have multiple mapper objects in the same model showing different groups - made easier by the addition of a 'groupName' label on the mapper. You can easily change the height at which the map is draw using the 'zdraw' label and alter the sampling interval and grid size using the 'heatInterval' and 'resolution' labels. The resolution is the number of divisions per model length unit. In the example model set to metres, a value of 2 gives 4 divisions per square metre.

Currently non-flowitems are set to ignore time when the object is in an idle state.


HeatMapAnything.fsl

HeatMapAnything.fsm

agvflowitemsheatmap
· 7
5 |100000

Up to 12 attachments (including images) can be used with a maximum of 23.8 MiB each and 47.7 MiB total.

kk avatar image kk commented ·

Hi, thanks for this model. I am currently using it in my simulation work, and it works well after adjusting the resolution.

I just need your help on something related to different MHEs moving on different paths. I have agv network setup for fork trucks and tuggers. Both the MHEs have different agv paths and always move on their paths. This is designed because fork trucks can take a U-turn on aisle, but a tugger need to find a junction to take a U-turn. So even though both MHEs are moving on different path but it essentially represent same aisle.

So, while drawing heatmap I need aisle heatmap not path heatmap.

I could just keep fork trucks and tugger in different heat mapper group, but this would just give me 2 different heatmap. But this is not something I want. I want to show "aggregated" heatmap for an aisle which account for all the traffic on that aisle irrespective of kind of MHE.

I hope I was able to convey my idea.

Also, it is good to know if heatmap scale is scaler or logarithmic for better interpretation of the results.

Hope we could solve this.

1 Like 1 ·
Jason Lightfoot avatar image Jason Lightfoot ♦♦ kk commented ·

The heat mapper projects the tracked object's location onto tiles in model space - the fact they're on different paths in the same location will make no difference.

0 Likes 0 ·
Arun Kr avatar image Arun Kr commented ·

@Jason Lightfoot In the updateMap code, absolute location is found using

Vec3 absloc=o.getLocation(midFactors).project(o.up,model());

Why projection is used here? If we simply use the

Vec3 absloc1=o.getLocation(midFactors);

The update will work rt?

0 Likes 0 ·
Jason Lightfoot avatar image Jason Lightfoot ♦♦ Arun Kr commented ·

It's safer/ more robust to not assume you know where o is - it might not be located in the model.

0 Likes 0 ·
Arun Kr avatar image Arun Kr Jason Lightfoot ♦♦ commented ·

Understood.

0 Likes 0 ·
MJ avatar image MJ commented ·

Thank you, Jason for sharing this!

I'd like to create a chart that shows the utilization of the AGV segments/links over time.
I'm wondering, if there is any way to access the map's raw data and make use of it. Or perhaps, may you recommend a simpler way to plot that chart ?


0 Likes 0 ·
Jason Lightfoot avatar image Jason Lightfoot ♦♦ MJ commented ·

Yes you can read the maps raw data, (as the draw code does). It uses model coordinates to create a grid which you'd then need to translate to paths.

0 Likes 0 ·

Article

Contributors

ben.wilson contributed to this article jason.lightfoot contributed to this article

Related Articles