question

Matheus Souza avatar image
0 Likes"
Matheus Souza asked Joerg Vogel commented

Is there a dashboard that shows the maximum time my buffer is taking?

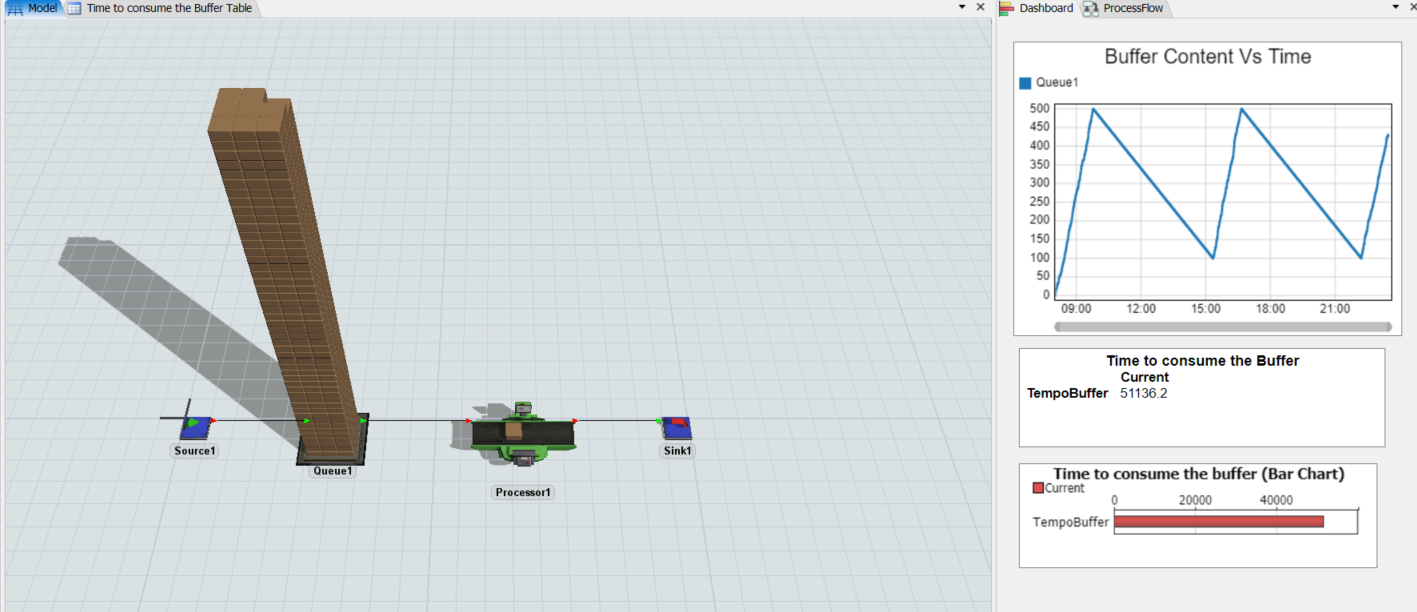
I have a queue of products, and I control that queue via trigger, opening the entry if the current quantity is less than 100 items, and closing when it reaches 500. So the line produces 400 items without the need to feed the buffer. I would like to see how long it is taking to consume the buffer. Taking into account that my process does not use a fixed time.

FlexSim 20.1.3
flexsim 20.1.3
· 2
5 |100000

Up to 12 attachments (including images) can be used with a maximum of 23.8 MiB each and 47.7 MiB total.

Joerg Vogel avatar image Joerg Vogel commented ·

I would try Content vs. Time plot graph. If you need conditional durations then you evaluate the data in calculated table or externally.

0 Likes 0 ·
Joerg Vogel avatar image Joerg Vogel Joerg Vogel commented ·

If you need two significant levels reported versus time, I suggest to split your one queue into two queues. They work in a row and the sum of their capacity is the total capacity of your single queue now. The second queue gets a capacity of the low level of reporting e.g. 100. The first gets the difference to the total capacity e.g. 400. The first queue collects only items, if the second reaches the maximum capacity level of 100.

1 Like 1 ·

1 Answer

·
Luis Gustavo Freitas avatar image
0 Likes"
Luis Gustavo Freitas answered Matheus Souza commented

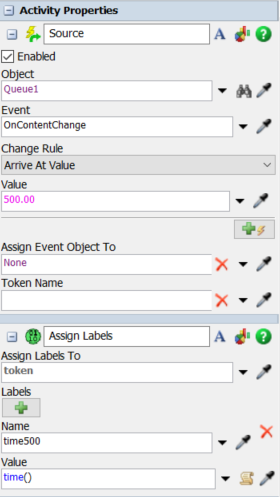
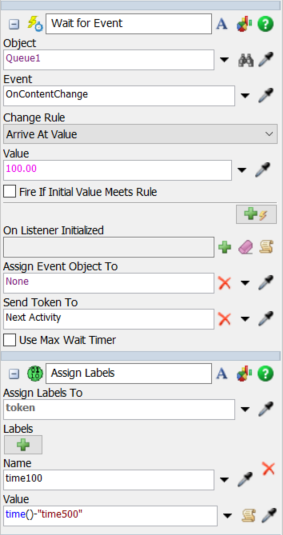
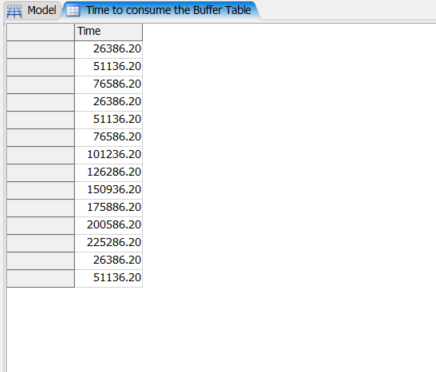
As @Jörg Vogel said, you can use a Content vs. Time plot for a graphical visualization of the buffer content. For more accurate tracking you can use the process flow to get these trigger times assigning labels (by using the function "time()", it return the exact time of the event). With that label getting that content 500 time, you can use another label to get the content 100 time and subtract them, as you can see in the image bellow:

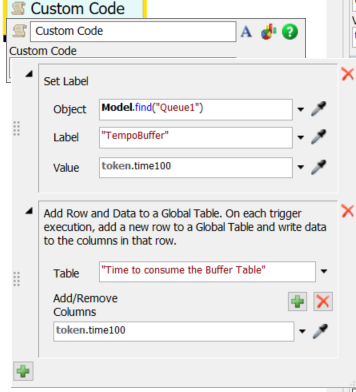
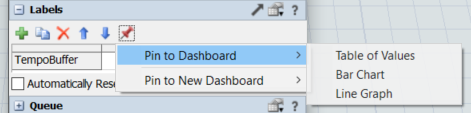
After this you can set that token label into any resource on 3D model and pin that label statistc on dashboard or write that time into a global tabel

I'm leaving the model below, this is a way to do this, let me know if it helped and fulfill your doubt.

BufferConsumeTime.fsm


1619662186804.png (51.0 KiB)
1619662230916.png (60.0 KiB)
1619662594744.png (55.6 KiB)
1619662782621.png (28.4 KiB)
1619662845278.png (245.0 KiB)
1619662874890.png (33.3 KiB)
· 1
5 |100000

Up to 12 attachments (including images) can be used with a maximum of 23.8 MiB each and 47.7 MiB total.

Matheus Souza avatar image Matheus Souza commented ·

Thanks Luis Gustavo. It is exactly what I need.

0 Likes 0 ·

Write an Answer

Hint: Notify or tag a user in this post by typing @username.

Up to 12 attachments (including images) can be used with a maximum of 23.8 MiB each and 47.7 MiB total.