Hi,
I have an example of a list here where I want to display what will be the maximum backorder created aggregated per week number. Is there any way to do this?
test_list_3.fsm
Hi,
I have an example of a list here where I want to display what will be the maximum backorder created aggregated per week number. Is there any way to do this?
test_list_3.fsm
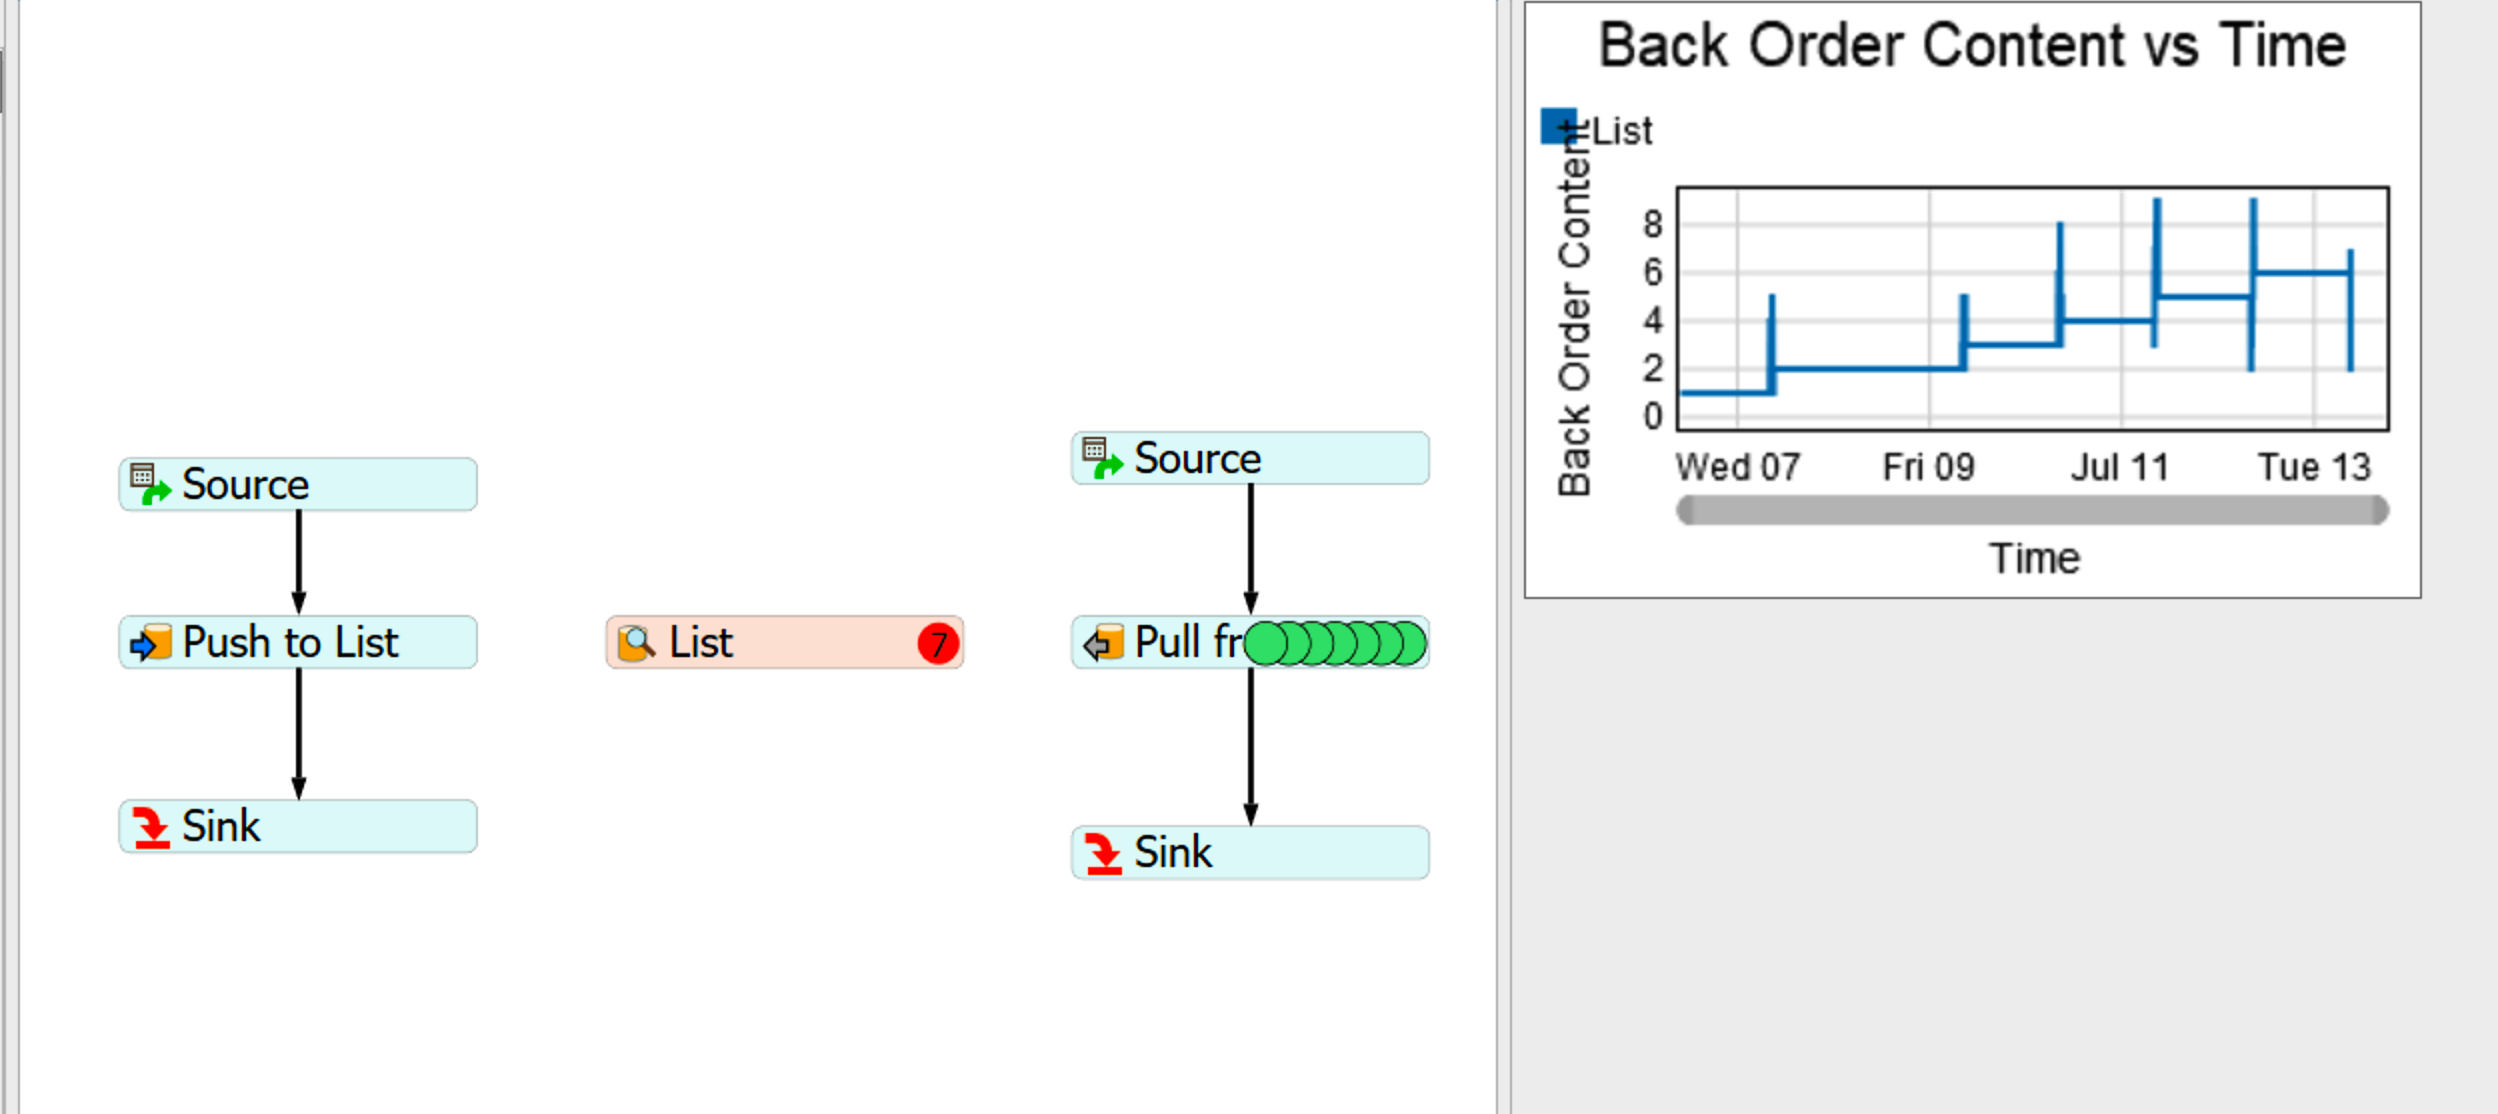
Hi @Vinayak N2, I added a column in the Stats Collector called "Week" that records the current week and then use a partition in a calculated table to determine the maximum content for each week. I also charted the results in the dashboard.
I used some code to calculate what week the model is in when the content changes (always 7 days from the start day, so in your case, updated every Tuesday). I start by finding the day. I use the command Model.dateTime.totalDays and record the initial value in a global variable that is set using a Model trigger on reset. That way, no matter what you change your start time / day to be, it will be updated in the logic. The current day is then calculated by finding the difference between the current day and starting day (rounding down) and the week is calculated by dividing the total days by 7 (rounding down).
Let me know if you have any questions. You can look at the table generated by the Stats Collector to see what's being recorded.
14 People are following this question.
FlexSim can help you understand and improve any system or process. Transform your existing data into accurate predictions.
FlexSim is a fully 3D simulation software environment. FlexSim can be used to simulate any process in any industry.
FlexSim®, FlexSim Healthcare™, Problem Solved.®, the FlexSim logo, the FlexSim X-mark, and the FlexSim Healthcare logo with stylized Caduceus mark are trademarks of FlexSim Software Products, Inc. All rights reserved.
