question

Maryam H2 avatar image
0 Likes"
Maryam H2 asked Maryam H2 commented

Frequency of the Chart Data

Hi there,

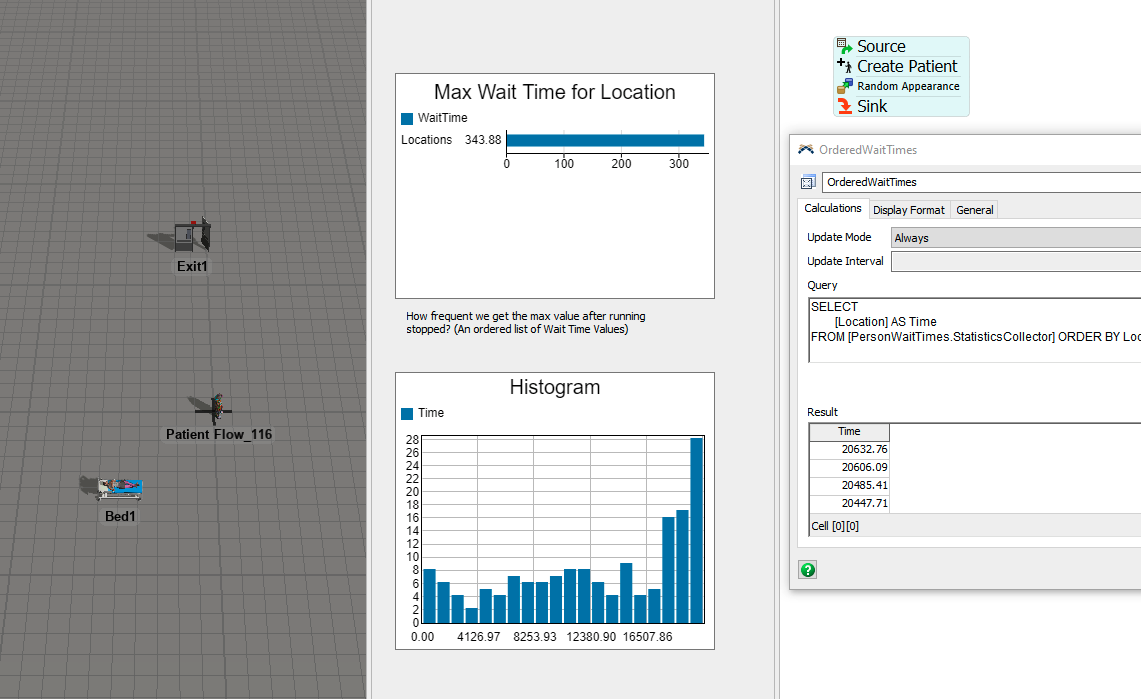
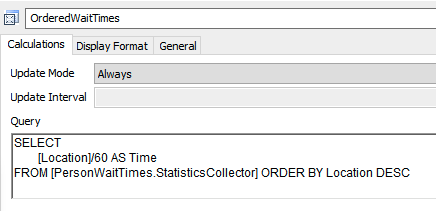
How we can get the frequency of chart data. For example, If we create a calculated table to calculate the maximum "Wait Time for a Location" and the maximum wait time reports XX minutes, how we can get the frequency of that max value? I see in the "Person Statistic Tables> Person Wait Times" the value of wait times aggregated for all locations.


Thanks!

FlexSim 22.0.0
statistics collectorwait timesmax wait time
5 |100000

Up to 12 attachments (including images) can be used with a maximum of 23.8 MiB each and 47.7 MiB total.

1 Answer

·
Felix Möhlmann avatar image
0 Likes"
Felix Möhlmann answered Maryam H2 commented

You can do this in a single query.

SELECT [colName], COUNT([colName]) FROM tableName GROUP BY [colName] ORDER BY [colName] DESC

will return a table with the values from the specified column in descending order next to the number of how often that value appears in the table. If you only want to see the highest value (which would always be in the first row) you can add "LIMIT 1" to the end of the query.

· 12
5 |100000

Up to 12 attachments (including images) can be used with a maximum of 23.8 MiB each and 47.7 MiB total.

Maryam H2 avatar image Maryam H2 commented ·

@Felix Möhlmann Thanks for the answer!

I was wondering which query you meant. Do you mean the "Query" window under the "Calculation" tab in the relative calculated table? If so, do I need to add the query you mentioned in addition to the query that is already there?

In that case, I'm getting errors.

0 Likes 0 ·
Felix Möhlmann avatar image Felix Möhlmann Maryam H2 commented ·

Either use the table.query command and clone the result to a global table

table.query(...).cloneTo(Table("tableName")) 

Rr directly in the query of a calculated table ("Enable direct editing").

WaitTimesCalcTable.fsm

0 Likes 0 ·
Maryam H2 avatar image Maryam H2 Felix Möhlmann commented ·

waittimescalctable_1.fsm@Felix Möhlmann Thanks!


I'm getting errors. Could you take a look at the attached model and let me know how I can set a table or calculated table that gives me the frequency of max wait times?


0 Likes 0 ·
Felix Möhlmann avatar image Felix Möhlmann Maryam H2 commented ·

I'm not seeing any errors in the attached model. Also, since the wait times are decimal values, counting the occurrences of a value will only yield one the majority of the time. Maybe simply plotting the wait times in a histrogramm might be a possibility?

1638994359115.png

waittimescalctable-1_1.fsm

1 Like 1 ·
Maryam H2 avatar image Maryam H2 Felix Möhlmann commented ·
@Felix Möhlmann Histogram is a good idea! I just do not understand why the wait times are these big numbers. Are those numbers in the x-axis real?
0 Likes 0 ·
Felix Möhlmann avatar image Felix Möhlmann Maryam H2 commented ·
Yes, those numbers are real. The times are shown in seconds in the histogramm whereas your calculated table returns a value in minutes (343.88*60 ~= 20632.76).

In the example model the last patients arrive at around 11am and still haven't acquired the bed when it stops at 4pm.

1 Like 1 ·
Maryam H2 avatar image Maryam H2 Felix Möhlmann commented ·
@Felix Möhlmann Thanks for the reply!

I know the model is created in seconds but is there any way to change the time format of the "Ordered Wait Times" or the "Histogram" to minutes?

Also, is this histogram/ordered table is gonna work right through the Experimenter as well?

0 Likes 0 ·
Felix Möhlmann avatar image Felix Möhlmann Maryam H2 commented ·

You can divide the "Location" value by 60 to get minutes directly in the query.

1639072972910.png

And yes, Calculated Tables and connected dashboard charts are saved for experiment scenarios/replications like other charts, if you activate the "Save statistics data for each replication" option.

1639073120104.png

1639073152289.png

1 Like 1 ·
1639072972910.png (6.8 KiB)
1639073120104.png (13.6 KiB)
1639073152289.png (18.3 KiB)
Maryam H2 avatar image Maryam H2 Felix Möhlmann commented ·
Got it, thanks!
0 Likes 0 ·
Maryam H2 avatar image Maryam H2 Felix Möhlmann commented ·
@Felix Möhlmann If I have different groups of locations and want to create separate tables/histograms for each how do I change the query?
0 Likes 0 ·
Felix Möhlmann avatar image Felix Möhlmann Maryam H2 commented ·

The data in the person and location tables does not contain a column that specifies the group they belong to so they have to joined with the "LocationGroups" table that does.

Then you can query for entries of any of the groups by adding the condition that the location must belong to it.

waittimescalctable-2.fsm

I would like to ask you to post this as a new question, so other users that might have a similar question can find the answer more easily in future.

1 Like 1 ·
Maryam H2 avatar image Maryam H2 Felix Möhlmann commented ·

It worked, Thanks.

Okay, I'll post a new question.

0 Likes 0 ·

Write an Answer

Hint: Notify or tag a user in this post by typing @username.

Up to 12 attachments (including images) can be used with a maximum of 23.8 MiB each and 47.7 MiB total.