question

Arvind J avatar image
0 Likes"
Arvind J asked Ryan Clark commented

Change output value in dashboard

Hi, need your advice.

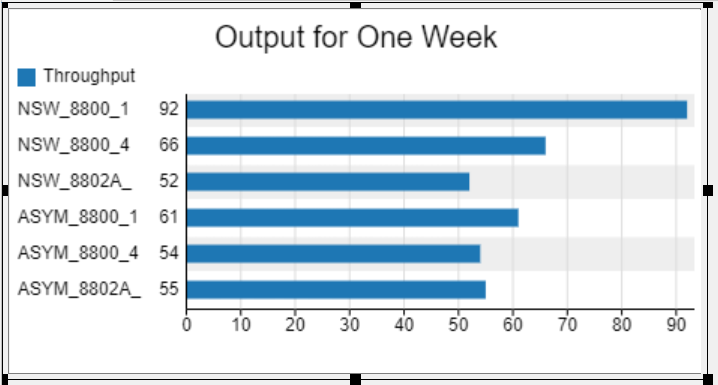
How to multiply/change output value in dashboard as shown in the picture below.

All these value (92, 66, 52, 61, 54, 55) must multiply with 10 x 20 .

eg;

92 x 10 x 20 = 18400

66 x 10 x 20 = 13200

I want this 18400 shown in the dashboard below instead of 92.

TIM DISPENSE.fsm microsoftteams-image.png

FlexSim 21.1.4
dashboardsprocesstimedashboard datachange
· 2
5 |100000

Up to 12 attachments (including images) can be used with a maximum of 23.8 MiB each and 47.7 MiB total.

Joerg Vogel avatar image Joerg Vogel commented ·
0 Likes 0 ·
Ryan Clark avatar image Ryan Clark commented ·

Hi @Arvind J, was Felix Möhlmann's answer helpful? If so, please click the "Accept" button at the bottom of their answer. Or if you still have questions, add a comment and we'll continue the conversation.

If we haven't heard back from you within 3 business days we'll auto-accept an answer, but you can always unaccept and comment back to reopen your question.

0 Likes 0 ·

1 Answer

·
Felix Möhlmann avatar image
2 Likes"
Felix Möhlmann answered

I see you have already installed the components of the throughput chart. Open the statistics collector "Output for One Week Collector", go to the "Columns" tab and change the increment of the throughput value to 200. Instead of counting up in steps in 1, the value will increase by 200 each time.

1641972013182.png

1641972037966.png


1641972013182.png (45.1 KiB)
1641972037966.png (9.9 KiB)
5 |100000

Up to 12 attachments (including images) can be used with a maximum of 23.8 MiB each and 47.7 MiB total.

Write an Answer

Hint: Notify or tag a user in this post by typing @username.

Up to 12 attachments (including images) can be used with a maximum of 23.8 MiB each and 47.7 MiB total.