Hello,
I have multiple wait lines but there is not obvious way to create a dashboard showing Stay Time by Hour for each wait line.
Bayers Lake COC Model Option 1 - Mobile Station Attempt_8.fsm
Thanks!
Mark
Hello,
I have multiple wait lines but there is not obvious way to create a dashboard showing Stay Time by Hour for each wait line.
Bayers Lake COC Model Option 1 - Mobile Station Attempt_8.fsm
Thanks!
Mark
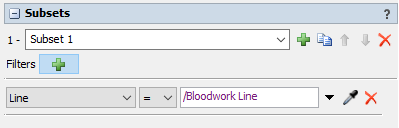
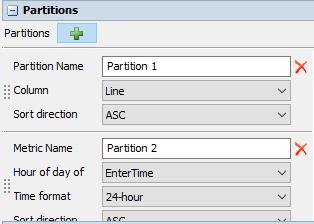
Do you mean something like this?
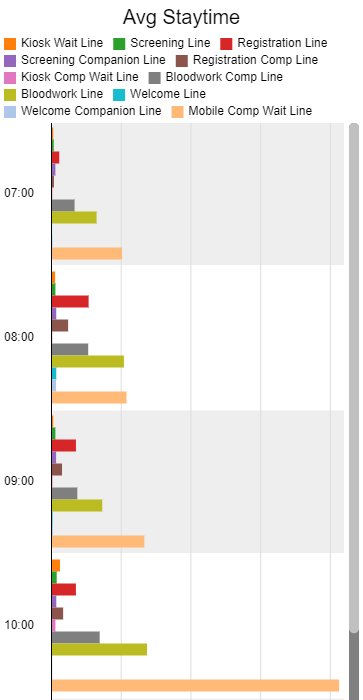
What I did to get this is to partition the Avg Staytime Chart by the Line and the hour of day.
11 People are following this question.
FlexSim can help you understand and improve any system or process. Transform your existing data into accurate predictions.
FlexSim is a fully 3D simulation software environment. FlexSim can be used to simulate any process in any industry.
FlexSim®, FlexSim Healthcare™, Problem Solved.®, the FlexSim logo, the FlexSim X-mark, and the FlexSim Healthcare logo with stylized Caduceus mark are trademarks of FlexSim Software Products, Inc. All rights reserved.
May we collect and use your data?
Learn more about the Third Party Services we use and our Privacy Statement.May we collect and use your data to tailor your experience?
Explore the benefits of a customized experience by managing your privacy settings for this site or visit our Privacy Statement to learn more about your options.