question

Ankur A3 avatar image
0 Likes"
Ankur A3 asked Felix Möhlmann commented

Average Hourly utilization Chart for Day?

Hi Team,

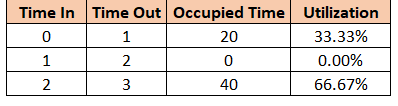
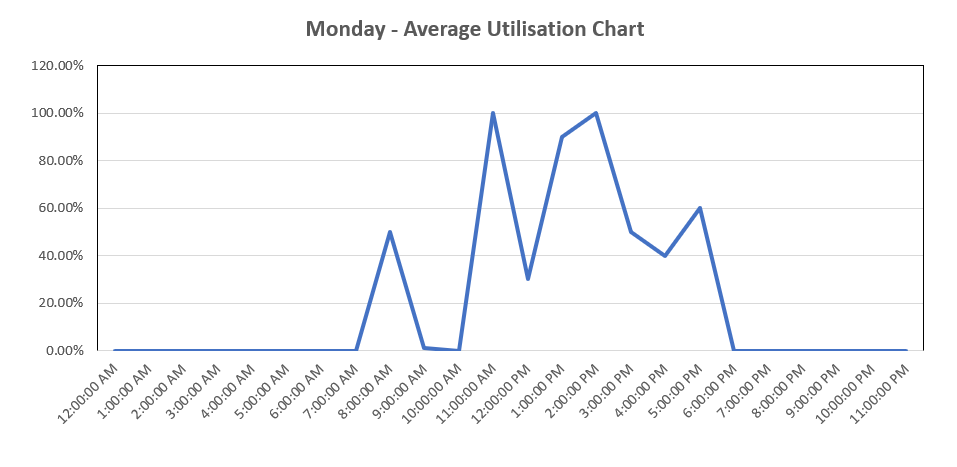
I have captured in and out time for a process along with weekday. I want to plot avg hourly utilization chart for each weekday (Mon, Tue) from this data on dashboard as below:

1652683565664.png

Is there any way to do it?

Thank you!

HourlyUtilizationCheck.fsm


FlexSim 21.0.10
weekdayhourly utilization chart
· 4
5 |100000

Up to 12 attachments (including images) can be used with a maximum of 23.8 MiB each and 47.7 MiB total.

Felix Möhlmann avatar image Felix Möhlmann commented ·
What exactly would the utilization be in this example?

- The percentage of time at least one token is in the delay activity?
- The average content divided (and bounded) by some capacity?
- Or something else?

0 Likes 0 ·
Ankur A3 avatar image Ankur A3 Felix Möhlmann commented ·

Hi @Felix Möhlmann,

It would be % of time in an hour. For eg:

1652783198364.png

0 Likes 0 ·
1652783198364.png (4.4 KiB)
Felix Möhlmann avatar image Felix Möhlmann Ankur A3 commented ·

So the first example I gave; percentage where at least one token is in the delay during the hour?

Because currently there are often multiple tokens in the delay in your model and summing their occupation time together would result in a utilization above 100%.

0 Likes 0 ·
Show more comments

1 Answer

·
Felix Möhlmann avatar image
0 Likes"
Felix Möhlmann answered Felix Möhlmann commented

Your approach is definately valid. But as you noted, it requires quite a bit of coding to extract the utilization from the in-out-times.

I will suggest an alternative approach; to measure the utilization directly while the model is running.

In the attached file I added a kinetic tracked variable label to the process flow. The value of such a label can continuously change with a set rate (for example by +40 per hour).

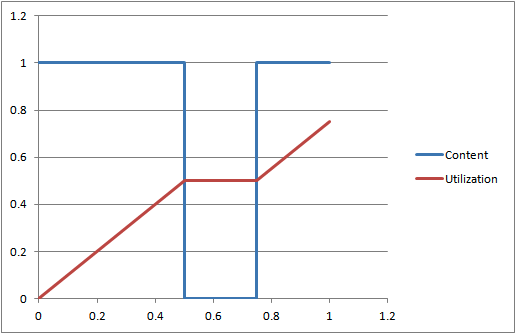
When a token enters the relevant section of the process a token to measure its impact on the utilization is created. This token increases the rate at which the variable changes by +1. When the main token exits or waits for more than hour the rate is decremented again, essentially counting the impact the token had on the utilization (60min -> the value has increased by 60 -> the token is counted for the whole hour; 25min -> the value has increased by 25 -> the token is counted for 5/12 of the hour).

The utilization token then creates another token which will mimic the rates changes but the other way around (first -1 than back to 0) and with an offset of one hour. So one hour after the main token has left, its impact on the utilization is back to 0.

The tracked variable essentially measures the total time (in model time units) tokens spend in the delay activity in the last hour as a 'rolling' value. This also has the advantage that you can grab the current value at any time, not just the full hour, to get a rolling average and a smoother curve (for example, at 9:45, the value would show the occupation time between 8:45-9:45). Dividing the value by the model time units per hour then gives the utilization.

The attached model also contains a statistics collector that feeds a line graph which plots the utilization split by week day. To be able to split the graph by weekday, the day is noted in an extra column of the collector's table. To be able to average over multiple weeks, the 'row value' is a combination of the weekday and the measure time. So as long as the measure times stay constant for each week, the previous values can be updated rather than adding a new row.

For this, one more column tracks how many weeks are already included in the current value. So to get the total average you can calculate (previousValue * weeks + currentValue)/(weeks+1).

(gif shows the updating graph on the second monday)

realtimeupdate.gif

hourlyutilizationcheck_fm.fsm

Edit:

The model uses the actual model date rather than the 'weekday' token label, thus the first graph is for tuesday (19th april 2022, 'Dienstag', because german Windows)


· 2
5 |100000

Up to 12 attachments (including images) can be used with a maximum of 23.8 MiB each and 47.7 MiB total.

Ankur A3 avatar image Ankur A3 commented ·

Hi @Felix Möhlmann,

Since this type of approach is completely new for me, It would be good if you can explain in different way with simple example. I tried to understand but couldn't.

Thank you for your support!

0 Likes 0 ·
Felix Möhlmann avatar image Felix Möhlmann Ankur A3 commented ·

Let's take the example that a token enters at 08:00 at stays until 08:30. During that time, the tracked variable will continuously increase at a rate of 1/min. This represents the amount of time the resource was occupied. After 5min it would have been occupied for 5min after 20min for 20 etc. When the token leaves at 08:30, the rate is set back to zero and the value stays at a constant value of 30; the resource was occupied for 30min during the last hour.

This will stay that way until 09:00, where the time the token occupied the resource for starts to fall out of the one hour time interval. So as before, the tracked variable will now decrease at a rate of 1/min.

At 9:15 only the last 15min of the token count towards the utilization in the last hour and the value will have fallen to 15. At 09:30 the value reaches zero again, because no token was active during the last hour.

Now let's say a second token enters at 08:45 and also stays for half an hour. This will cause the rate to increase to 1/min again and the tracked variable will count up to 45 until 09:00. (occupation from 08:00 to 08:30 and 08:45 to 09:00 -> 45min)

As before the occupation of the first token will now start to be subtracted from the value. But because the rate is still at 1/min due to the second token, the decrease only causes it to fall to 0 and the utilization will stay constant (The time of the first token falls out of the time window, but the time of the second is added to it at the same time).

When the second token leaves at 09:15, it stops having a positive impact on the occupation time and the rate goes to -1/min up until the 09:30, when the first token's time has been completely subtracted again and the occupation value reaches 30 (only the time from 08:45 to 09:15 is counted at that point). Then again, one hour after it arrived, the time of the second token starts to get subtracted and the value decreases down to 0 in the next 30min until 10:15.

The logic also has to account for the possibility that a token stays for longer than one hour. If this happens, the rate is adjusted down after one hour, so the occupation value doesn't exceed 60. The start of the subtraction is delayed to one hour after the token has left, because it will continue to impact the hourly utilization for a full hour if it stayed for at least that long.

This logic could in theory also account for multiple tokens using the 'resource' at the same time since they can both simultaneously increase the rate at which the tracked variable changes. With a maximum zone content of 2, you could end up with a value of up to 120 (two tokens using the resource for the entire last hour).

In mathematical terms, the tracked variable is the integral of the zone's content graph over the last hour.

1652879717184.png

I hope this turned out somewhat understandable. Maybe let the model run relatively slowly and observe how the process flow label behaviour changes when tokens enter/leave the zone.

0 Likes 0 ·
1652879717184.png (13.2 KiB)

Write an Answer

Hint: Notify or tag a user in this post by typing @username.

Up to 12 attachments (including images) can be used with a maximum of 23.8 MiB each and 47.7 MiB total.