Hi,
I was wondering how use the dashboard to show content in the different queues (current, min, max and average). I cant seem to get it work in the newest update
Thanks in advance
Hello @TomasAE,
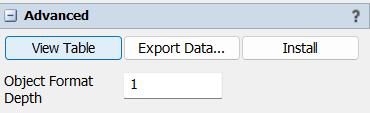
You can create this chart by placing a content table in the dashboard. Select the table, go to the advanced tab, and select install. Say Ok to the window that pops up.
 After that you will see over in the toolbox a statistics collector has been installed. Open that statistics collector and go to the column tab. You can add in columns for the statistics you would like to know. Change the update timing to be When the value is accessed.
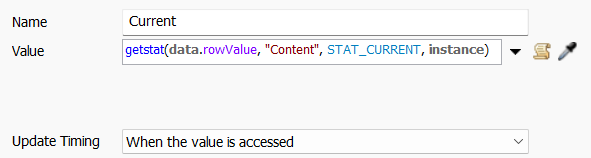
Notice for current content the code is
- getstat(data.rowValue, "Content", STAT_CURRENT, instance)
and for minimum content it is
- getstat(data.rowValue, "Content", STAT_MIN, instance)
The other statistics are similar.
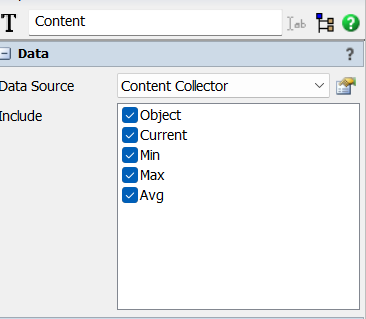
Once the statistics collector is updated how you want don't forget to select those columns to be shown on the chart (select the chart and then look over in the properties window).
14 People are following this question.
FlexSim can help you understand and improve any system or process. Transform your existing data into accurate predictions.
FlexSim is a fully 3D simulation software environment. FlexSim can be used to simulate any process in any industry.
FlexSim®, FlexSim Healthcare™, Problem Solved.®, the FlexSim logo, the FlexSim X-mark, and the FlexSim Healthcare logo with stylized Caduceus mark are trademarks of FlexSim Software Products, Inc. All rights reserved.
May we collect and use your data?
Learn more about the Third Party Services we use and our Privacy Statement.May we collect and use your data to tailor your experience?
Explore the benefits of a customized experience by managing your privacy settings for this site or visit our Privacy Statement to learn more about your options.