question

Ankur A3 avatar image
0 Likes"
Ankur A3 asked Ankur A3 commented

How to create time plot from zone partition?

Hi Team,

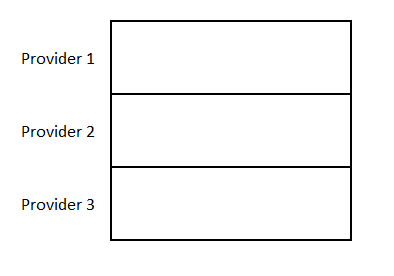
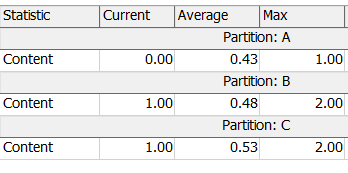
I am able to get content statistics based on partition type as below using zone.

1655964270538.png

I am also looking for content vs time plot based on zone partition but I could not find any option for that.

Is there any easy way to do it?

23.02.2022_TimePlotChartFromZonePartition.fsm

Thank you!


FlexSim 21.0.10
zonetime plotpartition
5 |100000

Up to 12 attachments (including images) can be used with a maximum of 23.8 MiB each and 47.7 MiB total.

1 Answer

Felix Möhlmann avatar image
0 Likes"
Felix Möhlmann answered Ankur A3 commented

A custom statistics collector that listens to the 'On Entry' and 'On Exit' events of the zone can be used.

The partition the token is entering/exiting is determined by its provider label. The collector then reads the content of that partition.

23022022-timeplotchartfromzonepartition_1.fsm


· 2
5 |100000

Up to 12 attachments (including images) can be used with a maximum of 23.8 MiB each and 47.7 MiB total.