question

Manus K avatar image
0 Likes"
Manus K asked Jeanette F commented

Multiple MTBF are independent?

I'm wondering how exactly MTBF/MTTR functions behave when combined. Let's use a simple example of 1 processor which is allocated to two different MTBF/MTTR functions. Are both functions running independently of each other? Is the MTBF "clock" of one function stopped during a breakdown caused by the other?

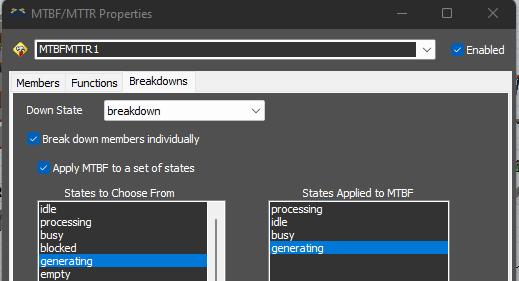
I ran a simple experiment with 2 processors and two identically defined MTBFMTTR functions. Function 1 is applied to processor 1 and 2 independently. Function 2 is applied to only processor 2. MTBF is defined as an exponential distribution and MTTR as a gamma distribution.

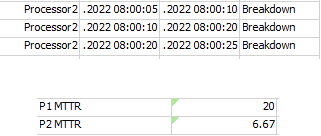
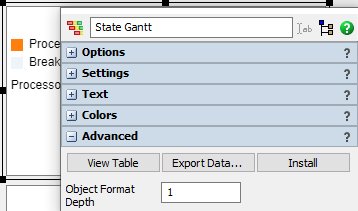
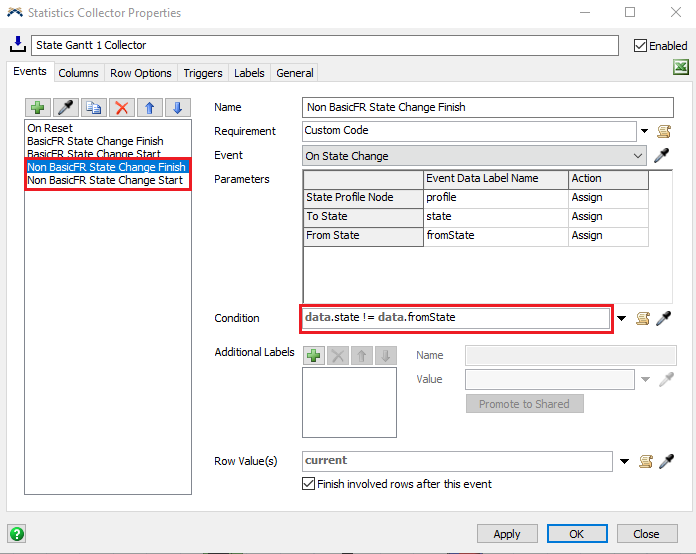
To analyze the results I used the state gantt chart to define a performance measure based on the average breakdown time.

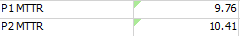
I expected the resulting MTTR for processor 2 to be either the same as processor 1 or slightly higher as failures might overlap. However, to my surprise MTTR for processor 2 are consistently lower than for processor 1.

Is that result of the MTBF/MTTR functions? Or does the gantt chart in case of overlapping breakdowns count them individually? This could explain how the second breakdown cuts short the accounted duration of the first breakdown.


simple OEE.fsm

FlexSim 22.1.3
mtbf mttrdowntimeoee
simple-oee.fsm (189.1 KiB)
· 1
5 |100000

Up to 12 attachments (including images) can be used with a maximum of 23.8 MiB each and 47.7 MiB total.

Jeanette F avatar image Jeanette F ♦♦ commented ·

Hi @Manus K, was one of Manus K's or Felix Möhlmann's answers helpful? If so, please click the "Accept" button at the bottom of the one that best answers your question. Or if you still have questions, add a comment and we'll continue the conversation.

If we haven't heard back from you within 3 business days we'll auto-accept an answer, but you can always unaccept and comment back to reopen your question.

0 Likes 0 ·
Felix Möhlmann avatar image
0 Likes"
Felix Möhlmann answered Joerg Vogel commented

Yes, the gantt chart collector adds a new row every time the state of the object changes. This includes changing to the same state it was in before. So for the sake of the statistic, if two breakdowns overlap, the first one 'ends' when the second starts.

In fact, if the second one ends before the first, another state change will occur and the two overlapping breakdowns are counted as three for the purpose of the average MTTR.

1658301309665.png

I guess this also sort of answers your original question. Yes, the MTBF/MTTR act independently from each other. If breakdowns overlap, the repair time for both counts down simultaneously.


1658301309665.png (4.6 KiB)
· 2
5 |100000

Up to 12 attachments (including images) can be used with a maximum of 23.8 MiB each and 47.7 MiB total.

Jason Lightfoot avatar image Jason Lightfoot ♦ commented ·

You can eliminate this by setting the unplanned stops to only occur in a subset of states via the Breakdowns tab.

1658307195777.png


1 Like 1 ·
1658307195777.png (17.5 KiB)
Joerg Vogel avatar image Joerg Vogel commented ·
I would check if it makes a difference when you choose different stop ID values for your breakdowns.

A more advanced approach would be to delay events in the event list when overlapping stop calls are being processed. You can check if a pending stop event exists if an new one is executed, then you delay existing resume events to be executed simultaneously synchronized with later one.

0 Likes 0 ·
Manus K avatar image
0 Likes"
Manus K answered Felix Möhlmann commented

Is there any best practice when it come to gather statistics. If I have overlapping MTBF/MTTRs, I would like to be able to retrieve a true MTBF and MTTR.

The solution isn't as easy as just counting failures with 0 time between as joined failures. Even if only 1 MTBF/MTTR is defined there are times between failures of 0 as a result of the exponential distribution.

· 1
5 |100000

Up to 12 attachments (including images) can be used with a maximum of 23.8 MiB each and 47.7 MiB total.

Felix Möhlmann avatar image Felix Möhlmann commented ·

As a workaround, to count overlapping breakdowns as one, you can adjust the statistics collector of the gantt chart.

First, install the components of the chart. Be sure that the settings of the chart as how you want them before you do this, because this will disable some interface elements, such as the object selection.

1658383774573.png

Then open statistics collector that should appear in the toolbox and add the condition that the 'FromState' and 'ToState' have to be different for the collector to add a new row in the 'Non BasicFR' events..

1658383929359.png

You now won't get two successive rows with the same state, bundling overlapping failures into one row.

This results in the expected MTTR values; slightly higher for Processor2 than Processor1.

1658384098050.png

simple-oee(1).fsm

0 Likes 0 ·
1658383774573.png (11.1 KiB)
1658383929359.png (45.4 KiB)
1658384098050.png (1.2 KiB)
simple-oee1.fsm (770.5 KiB)

Write an Answer

Hint: Notify or tag a user in this post by typing @username.

Up to 12 attachments (including images) can be used with a maximum of 23.8 MiB each and 47.7 MiB total.