question

Yunjukuo avatar image
0 Likes"
Yunjukuo asked Jacob W2 commented

calculate the item's "waiting for Operator time" and display on Dashboard

Hello,

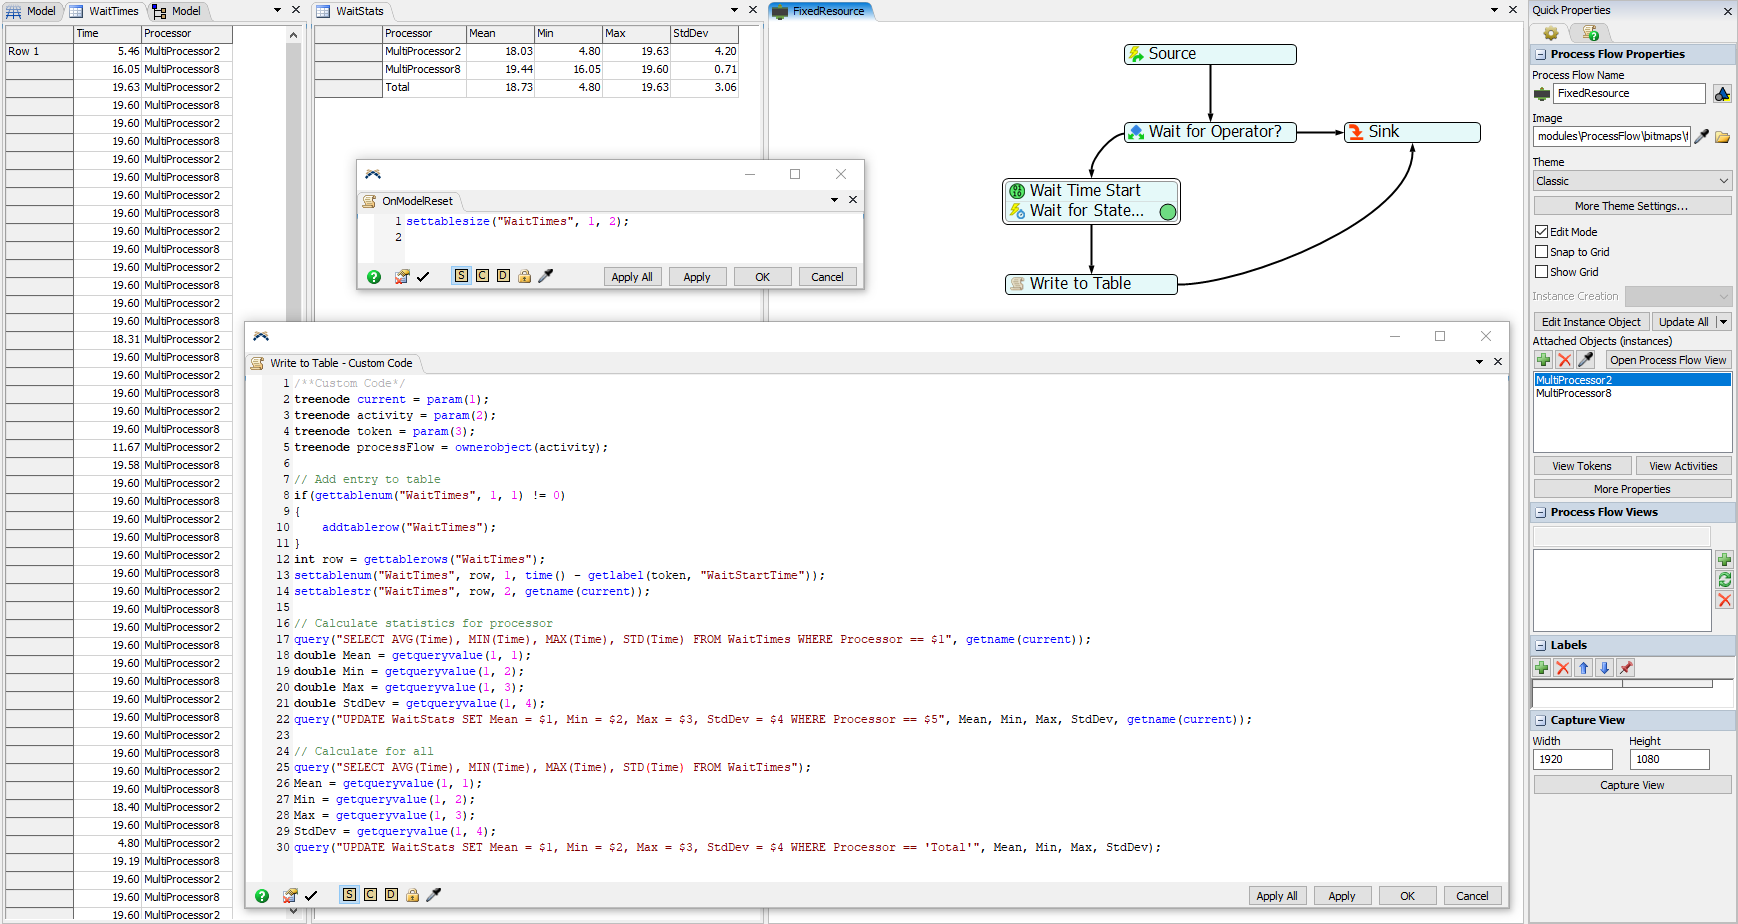
I'm analyzing those processes that wait a long time for operator. Below is a simple example. I have question of how to calculate below index and display them on dashboard.

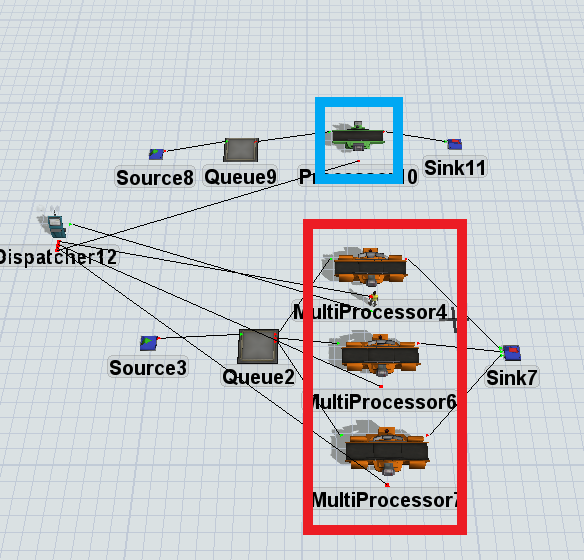
1. For a single machine (blue box): item's "waiting for Operator time" mean, min, max, standard deviation value

2. For group (red box): item's "waiting for Operator time" mean, min, max, standard deviation value

1658397223578.png

AvgWaitOPTime.fsm


FlexSim 16.1.2
operatorwait timedashboard chart
1658397223578.png (74.0 KiB)
avgwaitoptime.fsm (23.1 KiB)
· 3
5 |100000

Up to 12 attachments (including images) can be used with a maximum of 23.8 MiB each and 47.7 MiB total.

1 Answer

Andrew O avatar image
0 Likes"
Andrew O answered Fengjun0113 commented

Hi @Yunjukuo,

Here is a possible solution to your problem. Attached below is a model where process flow has been used to track the time it takes for an operator to get to your processor once an item has reached it. From there, a Statistics Collector stores that value, and a Calculated Table displays Mean, Min, Max, and Standard Deviation.

Also, your version of FlexSim(16.1) has reached end of life and has stopped being supported. We recommend updating to the latest version of the software.

avgwaitoptime - solution.fsm


· 11
5 |100000

Up to 12 attachments (including images) can be used with a maximum of 23.8 MiB each and 47.7 MiB total.