question

Liam Chiu avatar image
0 Likes"
Liam Chiu asked Jeanette F commented

How to present average time on dashboard?

Hi


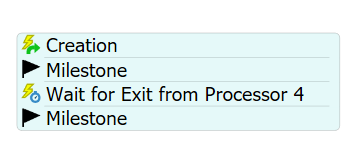
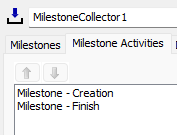
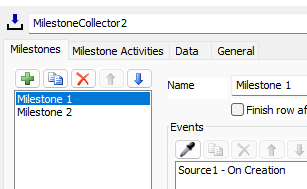
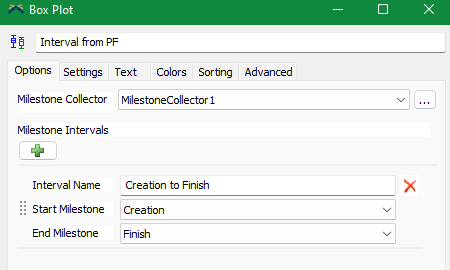
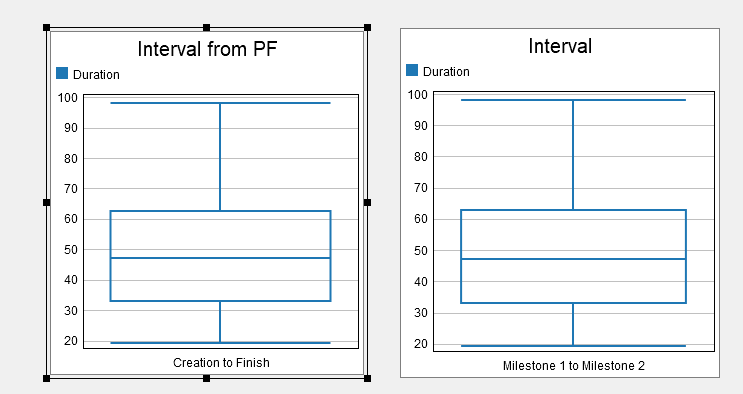
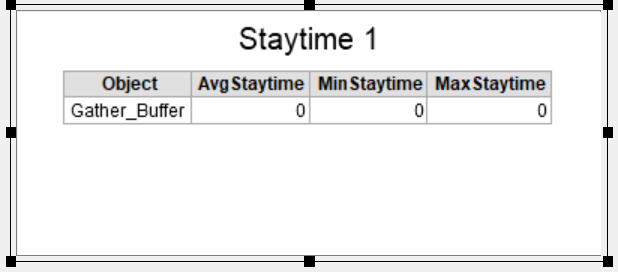
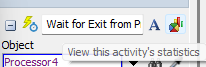
I'm trying to count the average time from source to processor4 and the average time for each of the three types. I would like to know if I can render this data on a dashboard~?


Thank you for your advance.


https://drive.google.com/file/d/118X0S-LZEyE8KqQCX0HHrEXz4Hbd3uZy/view?usp=sharing

FlexSim 20.1.3
dasbhoardaverage time
· 1
5 |100000

Up to 12 attachments (including images) can be used with a maximum of 23.8 MiB each and 47.7 MiB total.

Jeanette F avatar image Jeanette F ♦♦ commented ·

Hi @Wei_cheng Chiu, was Jeanette F's answer helpful? If so, please click the "Accept" button at the bottom of their answer. Or if you still have questions, add a comment and we'll continue the conversation.

If we haven't heard back from you within 3 business days we'll auto-accept an answer, but you can always unaccept and comment back to reopen your question.

0 Likes 0 ·

1 Answer

·
Jeanette F avatar image
0 Likes"
Jeanette F answered Jeanette F edited

Hello @Wei_cheng Chiu,

I suggest you use a milestone collector. There are two way you can do this.

One is to use process flow and to add milestone activities that the milestone collector references.

1662239750553.png1662239817447.png

The other is to open the milestone collector and create a milestone that references the objects.

1662239796733.png

Then add a interval chart to the dashboard and select the collector and select the interval you want.

1662239875252.png

Notice that with both methods the same chart is created.

1662239946632.png

Model Link


1662239750553.png (12.0 KiB)
1662239796733.png (11.3 KiB)
1662239817447.png (4.1 KiB)
1662239875252.png (12.5 KiB)
1662239946632.png (9.6 KiB)
· 2
5 |100000

Up to 12 attachments (including images) can be used with a maximum of 23.8 MiB each and 47.7 MiB total.

Liam Chiu avatar image Liam Chiu commented ·

@Jeanette F thanks ~ your advice is very helpful !!

I also want to know if these data can be presented in the form of the table below.

Thank you again for your help~~~ :)


1662310347302.png

0 Likes 0 ·
1662310347302.png (20.2 KiB)
Jeanette F avatar image Jeanette F ♦♦ Liam Chiu commented ·

The easiest way to do this would be to do the process flow method and select the wait for event activity and select its statistics and pin the staytime statistics.

1662471304609.png

1662471316458.png

In newer versions of FlexSim this would be easier to create from the charts

0 Likes 0 ·
1662471304609.png (7.2 KiB)

Write an Answer

Hint: Notify or tag a user in this post by typing @username.

Up to 12 attachments (including images) can be used with a maximum of 23.8 MiB each and 47.7 MiB total.