question

Rahul R avatar image
0 Likes"
Rahul R asked Felix Möhlmann answered

Chart for tracked variable over time Flexsim 2021 and 2022

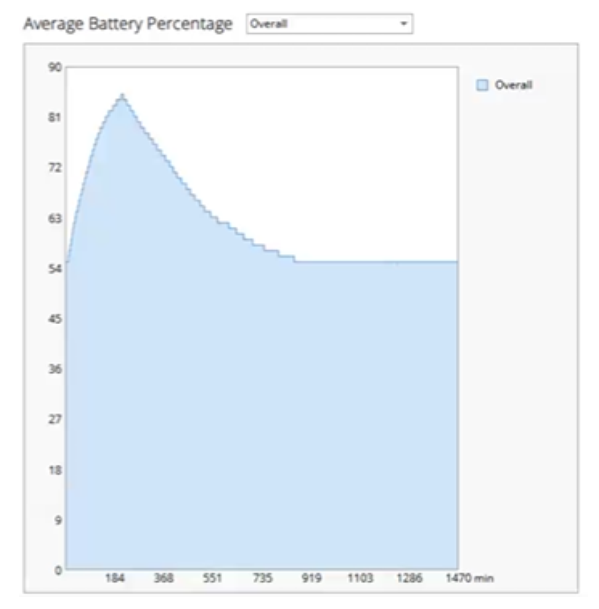
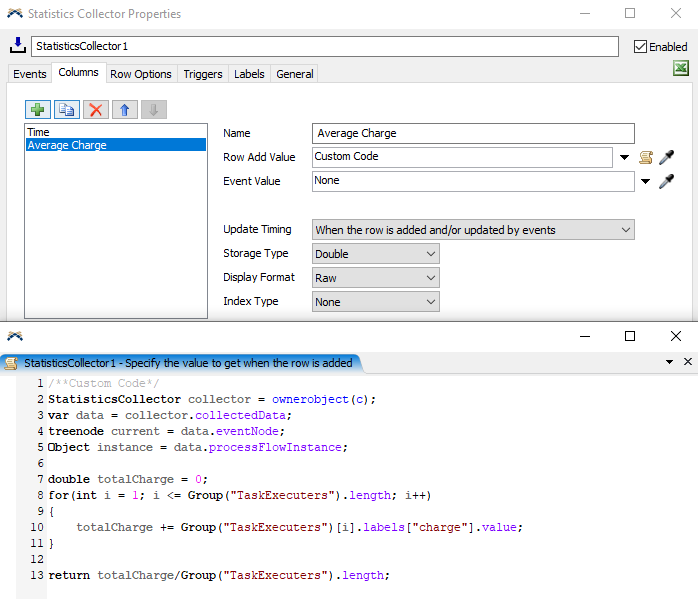
I am trying to plot average of a tracked variable for multiple task executer over time. The tracked variable is kinetic type. I have 4 task executers in the example model and the tracked variable is called "charge". Though the example model is in FS 2022, I hope the solution can work in FS 21 as well.


File name: Statistics collector_Kinetic variable change over time

1663739255762.png


FlexSim 22.1.4
statistic collectortracked variableskinetic tracked variable
1663739255762.png (51.2 KiB)
5 |100000

Up to 12 attachments (including images) can be used with a maximum of 23.8 MiB each and 47.7 MiB total.

1 Answer

·
Felix Möhlmann avatar image
0 Likes"
Felix Möhlmann answered

As long as you have a way to refer to the Task Executers (or the respective variables) you can calculate the average directly in the "Row Add Value" field of the statistics collector. The collector could trigger by a timer event or based on the change of one of the variables.

The example below assumes that the Task Executers are part of a group and that the tracked variables are implemented as a label on them.

1663756228904.png


1663756228904.png (54.0 KiB)
5 |100000

Up to 12 attachments (including images) can be used with a maximum of 23.8 MiB each and 47.7 MiB total.

Write an Answer

Hint: Notify or tag a user in this post by typing @username.

Up to 12 attachments (including images) can be used with a maximum of 23.8 MiB each and 47.7 MiB total.