question

Rahul R avatar image
0 Likes"
Rahul R asked Rahul R commented

Create a time plot of idle% for task executer group

I am trying to create a time plot for avg. idle% for task executer group. This will help me identify the times at which my TE group is loaded with work vs idle. Is there an easy way to do this or do I have to use statistics collector to create row every X minutes and calculate average of idle% for each task executer?

FlexSim 22.2.0
task executerstatesstate statisticsstatisctis collectortime plot
· 1
5 |100000

Up to 12 attachments (including images) can be used with a maximum of 23.8 MiB each and 47.7 MiB total.

Jason Lightfoot avatar image Jason Lightfoot ♦ commented ·

Hi @Rahul R, was our answer helpful? If so, please click the "Accept" button at the bottom of their answer. Or if you still have questions, add a comment and we'll continue the conversation.

If we haven't heard back from you within 3 business days we'll auto-accept an answer, but you can always unaccept and comment back to reopen your question.

0 Likes 0 ·

1 Answer

·
Jeanette F avatar image
0 Likes"
Jeanette F answered Rahul R commented

Hello @Rahul R,

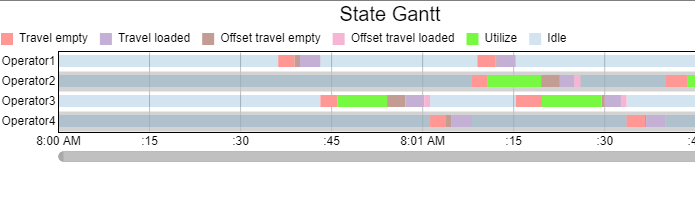
Would a State Gantt chart work for what you are looking for? It Shows when the operators are idle and busy. If this isn't what you are looking for then maybe the base statistics collector of this chart would be helpful to you.

1664244923012.png

Depending on the work that your Task Executers are doing you may find that a staytime by hour or output by hour is helpful for defining their workload as well.


1664244923012.png (12.6 KiB)
· 3
5 |100000

Up to 12 attachments (including images) can be used with a maximum of 23.8 MiB each and 47.7 MiB total.

Rahul R avatar image Rahul R commented ·
How do I understand what is on the base statistics collector for Gantt chart?
0 Likes 0 ·
Felix Möhlmann avatar image Felix Möhlmann Rahul R commented ·

You can access the gantt chart collector by 'installing' the charts components from the "Advanced" tab in its properties. Each row of the collector holds information about between which points in time the respective object was in a certain state.

You could use this table to determine the avg. utilization by summing up the time spend in the "idle" state within a given time window with a calculated table.

You can also, as you mention yourself, create a statistics collector from scratch for this. The attached model contains an example of how this can be done.

A timer event creates a new row for each object inside the group specified in the collector's labels. The timer interval is also defined as a label.

1664264557435.png

Each row then fills columns the current model time, the object it belongs it belongs to (equal to the row value) and how long that object has spent in the "idle" state in total during the simulation run.

1664264542790.png

The fourth column then calculates the percentage over the last interval by subtracting the last total idle time from the current idle time and dividing it by the length of the measurement interval.

1664264577659.png

This information (idle percentage per object) can then be aggregated into an average over the whole group in a calculated table. (Source table is the collector, the only column is a basic aggregate of the "IdleInterval" column, partitioned by the "Time" column)

1664264672242.png

StateOverTime_Chart.fsm

1 Like 1 ·
1664264542790.png (23.4 KiB)
1664264557435.png (34.8 KiB)
1664264577659.png (58.6 KiB)
1664264672242.png (56.2 KiB)
Rahul R avatar image Rahul R commented ·

@Felix Möhlmann This helps. Thank you!

0 Likes 0 ·

Write an Answer

Hint: Notify or tag a user in this post by typing @username.

Up to 12 attachments (including images) can be used with a maximum of 23.8 MiB each and 47.7 MiB total.