question

Jyhjeng D2 avatar image
0 Likes"
Jyhjeng D2 asked Jyhjeng D2 commented

build a content vs time plot for system

Hi:

I have a simple queuing model and I can get the content vs time plot for the waiting line. However, if I want to build a content vs time for the system, i.e., how many people in the system throughout the time, what should I do? Suppose the running time is only for 15 s. The inter-arrival time and process time are specified in tables 1 and 2 as shown in model attached.

simple-queue02.fsm

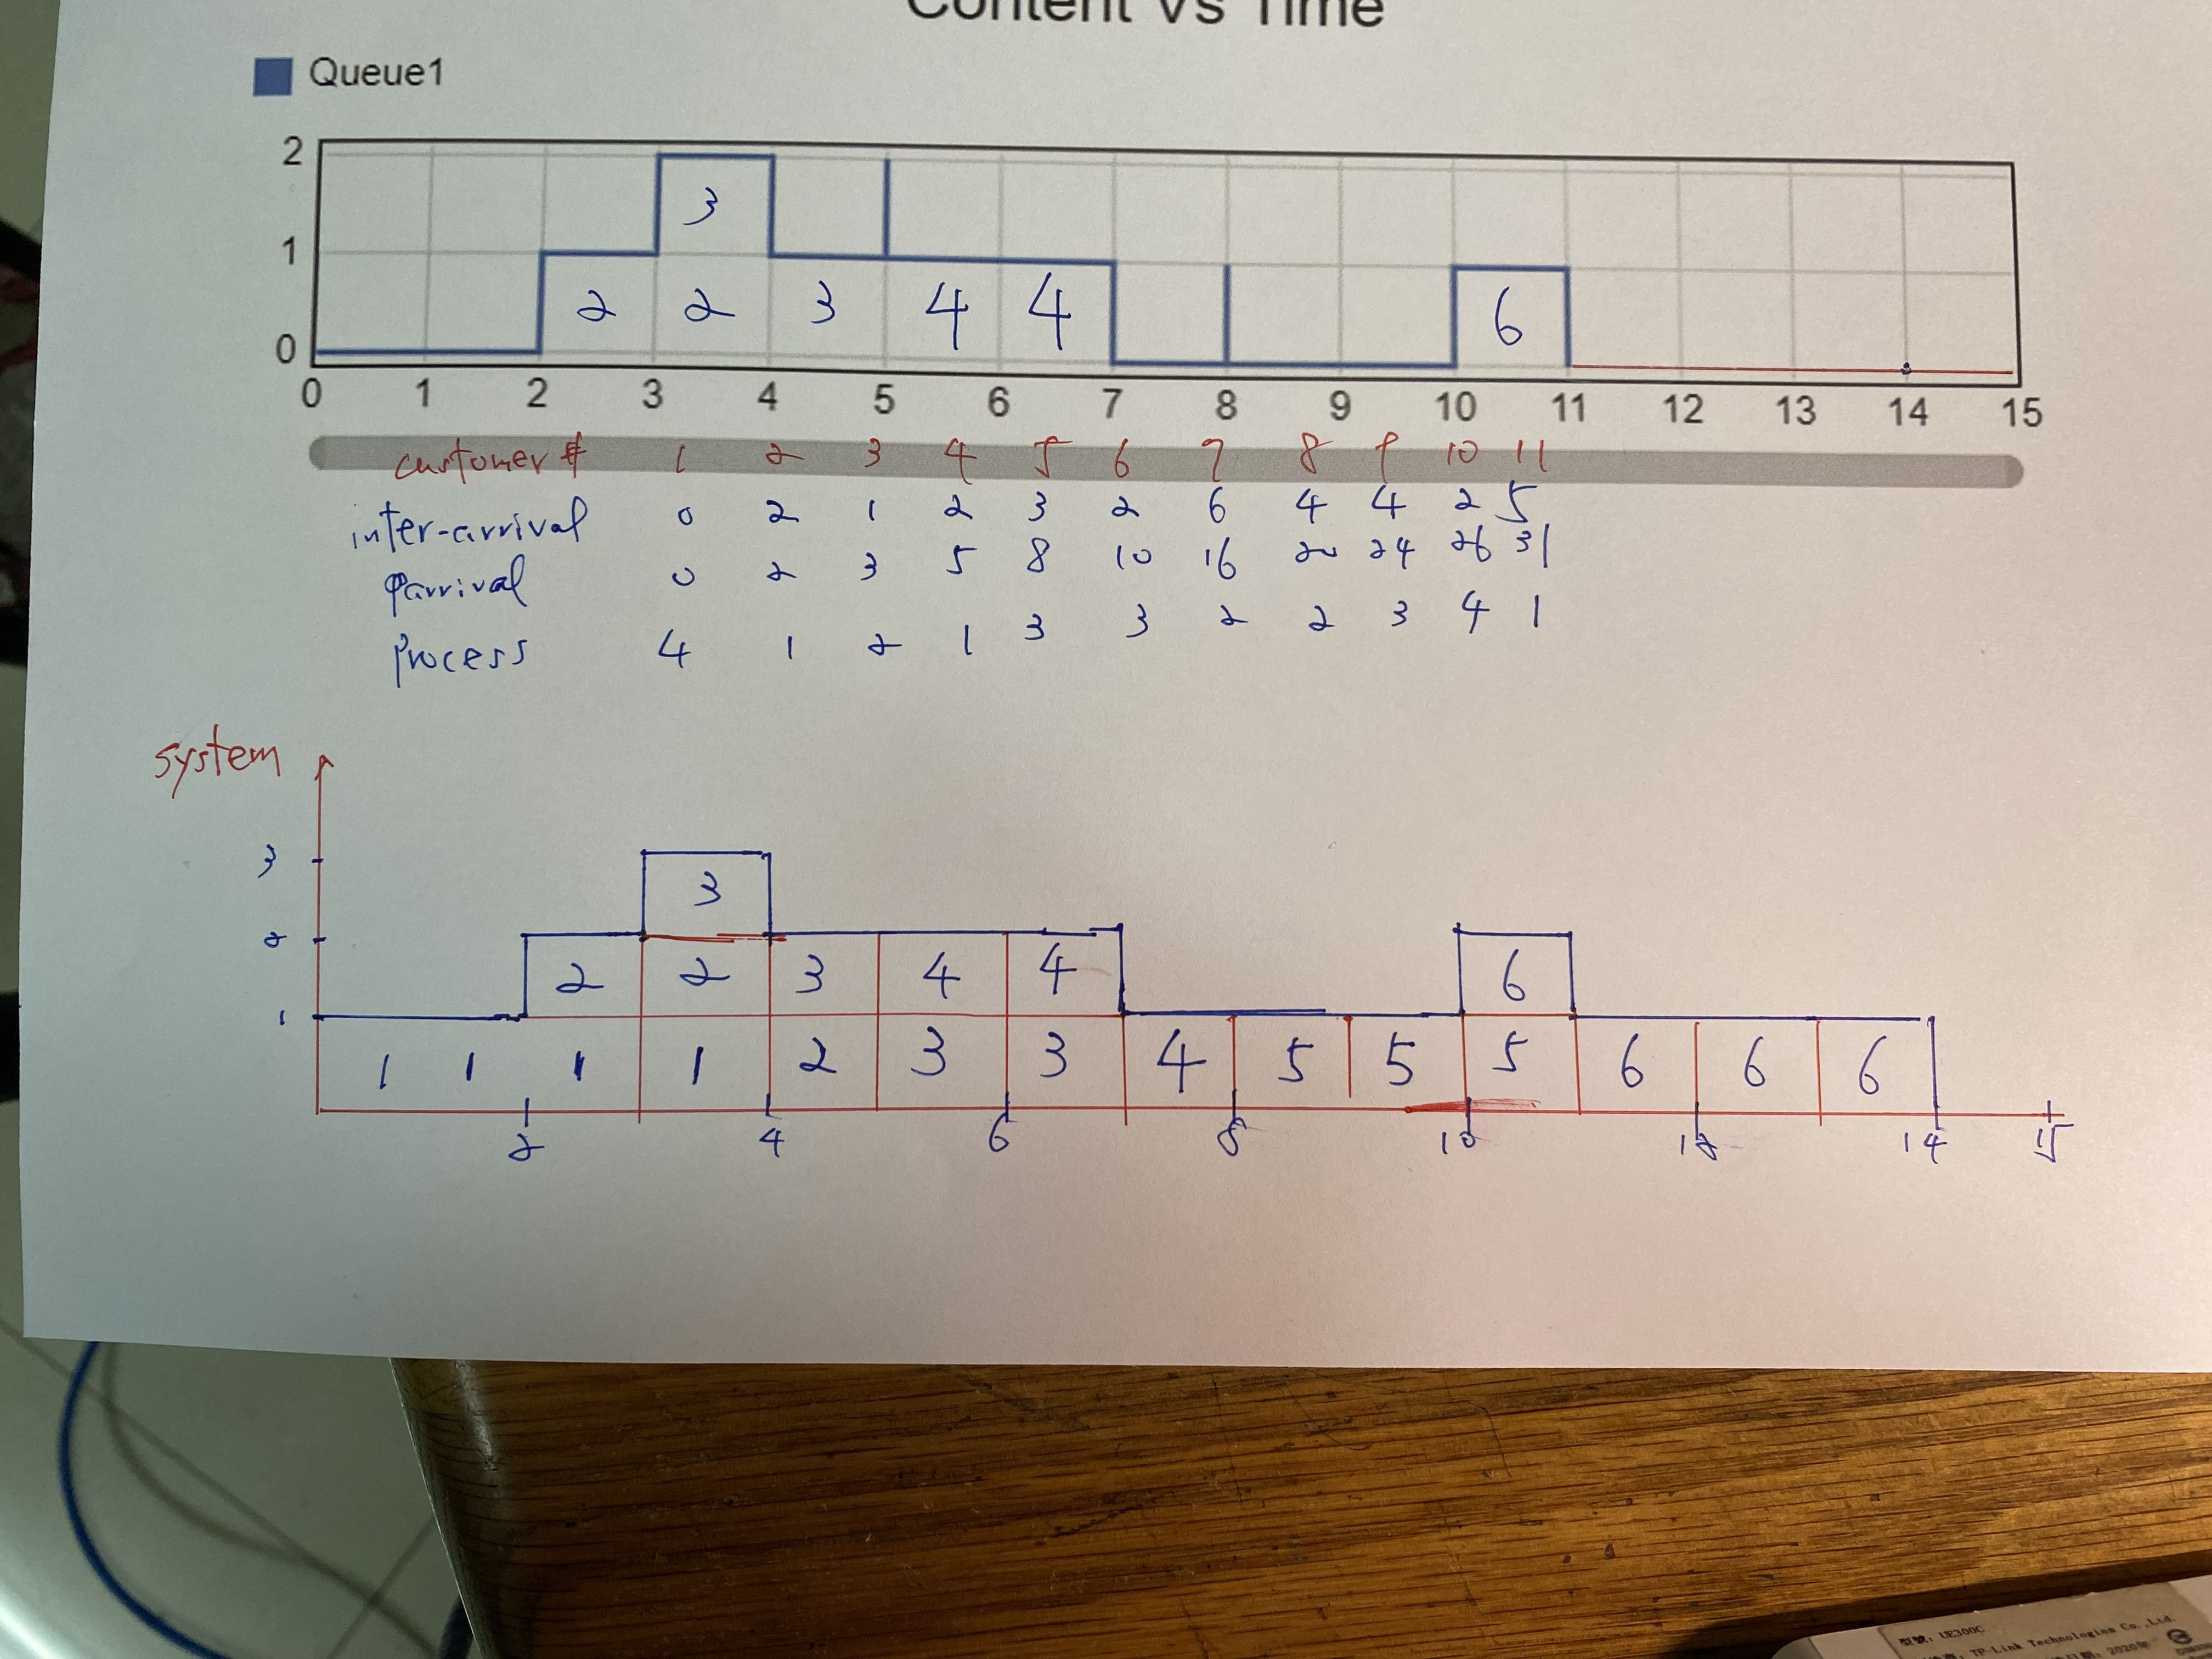
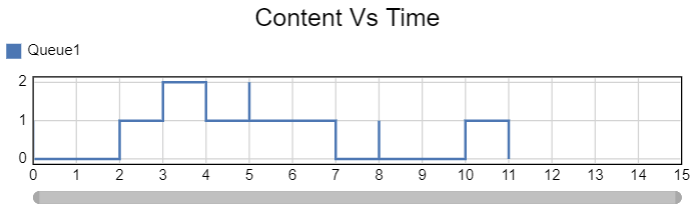
The content vs time plot for queue1 is below.

content-vs-time-waiting-line.png

The content vs time plot for system should be like below.

content-vs-time-for-system.jpg

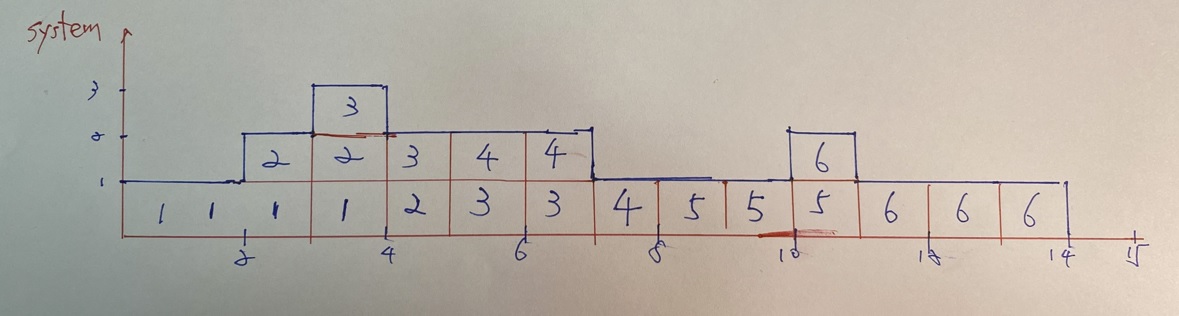
The number in the content vs time plot is the customer number. Their corresponding arrival time and process time is shown below together with two plots.

img-1324b.jpg

FlexSim 22.0.1
build a content vs time plot for system
5 |100000

Up to 12 attachments (including images) can be used with a maximum of 23.8 MiB each and 47.7 MiB total.

1 Answer

·
Felix Möhlmann avatar image
0 Likes"
Felix Möhlmann answered Jyhjeng D2 commented

The "Composite WIP" line chart does this. It measures how many items are in the system inbetween the "Entry Objects" and "Exit Objects". (Exit Object does not count as part of the system)

1675436869600.png

1675436858328.png


1675436858328.png (41.7 KiB)
1675436869600.png (19.4 KiB)
· 1
5 |100000

Up to 12 attachments (including images) can be used with a maximum of 23.8 MiB each and 47.7 MiB total.

Jyhjeng D2 avatar image Jyhjeng D2 commented ·

Hi Felex:

Your suggestion works fine. Thanks.

0 Likes 0 ·

Write an Answer

Hint: Notify or tag a user in this post by typing @username.

Up to 12 attachments (including images) can be used with a maximum of 23.8 MiB each and 47.7 MiB total.