question

Preet avatar image
0 Likes"
Preet asked Preet commented

How to get raw events with timestamps for each activity?

Hello!

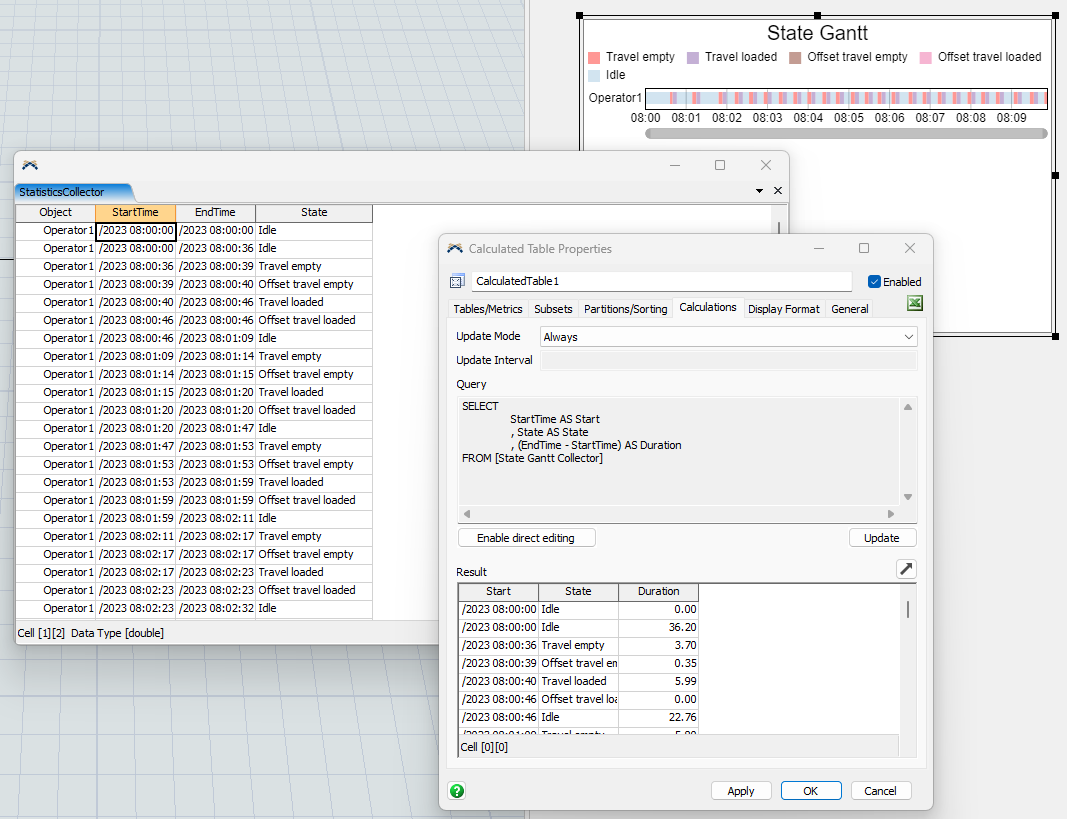
How to capture and export raw events (more specifically state change events) for various objects in the model? For example staff, task executor, fixed resources etc. I am able to see the values that goes into the graph by double clicking the graph --> Advanced --> View table. However, that shows aggregated data. Means, it shows total time spent rather than each event time.


For example, the screenshot shows how much total time the object spent in specific state. What I want is the raw data which will have timestamp of each state change possibly with time spent in each state. It may look like at 12:00 pm the operator was processing, at 12:05 pm the operator was travelling. With the the calculated processing time of 5 minutes. (12:05 - 12:00).

time.jpg

FlexSim 23.0.0
raw data export
time.jpg (50.3 KiB)
5 |100000

Up to 12 attachments (including images) can be used with a maximum of 23.8 MiB each and 47.7 MiB total.

1 Answer

·
Joerg Vogel avatar image
0 Likes"
Joerg Vogel answered Preet commented
· 9
5 |100000

Up to 12 attachments (including images) can be used with a maximum of 23.8 MiB each and 47.7 MiB total.

Felix Möhlmann avatar image Felix Möhlmann commented ·

For state changes a state gantt can be used. It collects and displays what is described above. If you install the chart components, the duration can be easily extracted in a calculated table.

1675840814062.png

stategantt.fsm

1 Like 1 ·
1675840814062.png (122.9 KiB)
stategantt.fsm (100.6 KiB)
Preet avatar image Preet Felix Möhlmann commented ·

Hi @Felix Möhlmann . This is exactly what I am looking for. I tried it but why I am getting different option when I select State Gantt than what you shared in the model? I see you mentioned install chart components. Is that related to that and how to do that?

1675876083164.png


0 Likes 0 ·
1675876083164.png (35.1 KiB)
Felix Möhlmann avatar image Felix Möhlmann Preet commented ·
Yes, in order to access the Statistics Collector that is used for the chart in the calculated table you have to install the chart's components (Install button in the "Advanced" tab at the bottom of the properties)
0 Likes 0 ·
Show more comments
Show more comments
Joerg Vogel avatar image Joerg Vogel commented ·

@Preet you will filter and analyze this data yourself.

0 Likes 0 ·

Write an Answer

Hint: Notify or tag a user in this post by typing @username.

Up to 12 attachments (including images) can be used with a maximum of 23.8 MiB each and 47.7 MiB total.