question

Anutt K avatar image
0 Likes"
Anutt K asked Julie Weller commented

Find parameter of distributions.

Hello. I wondering if in Expert Fit we can use to find Statistical Distribution from Raw Data.

So, If reverse. We know what type of Dristribution and quantity of Entity. Then we want to find parameter of distribution.

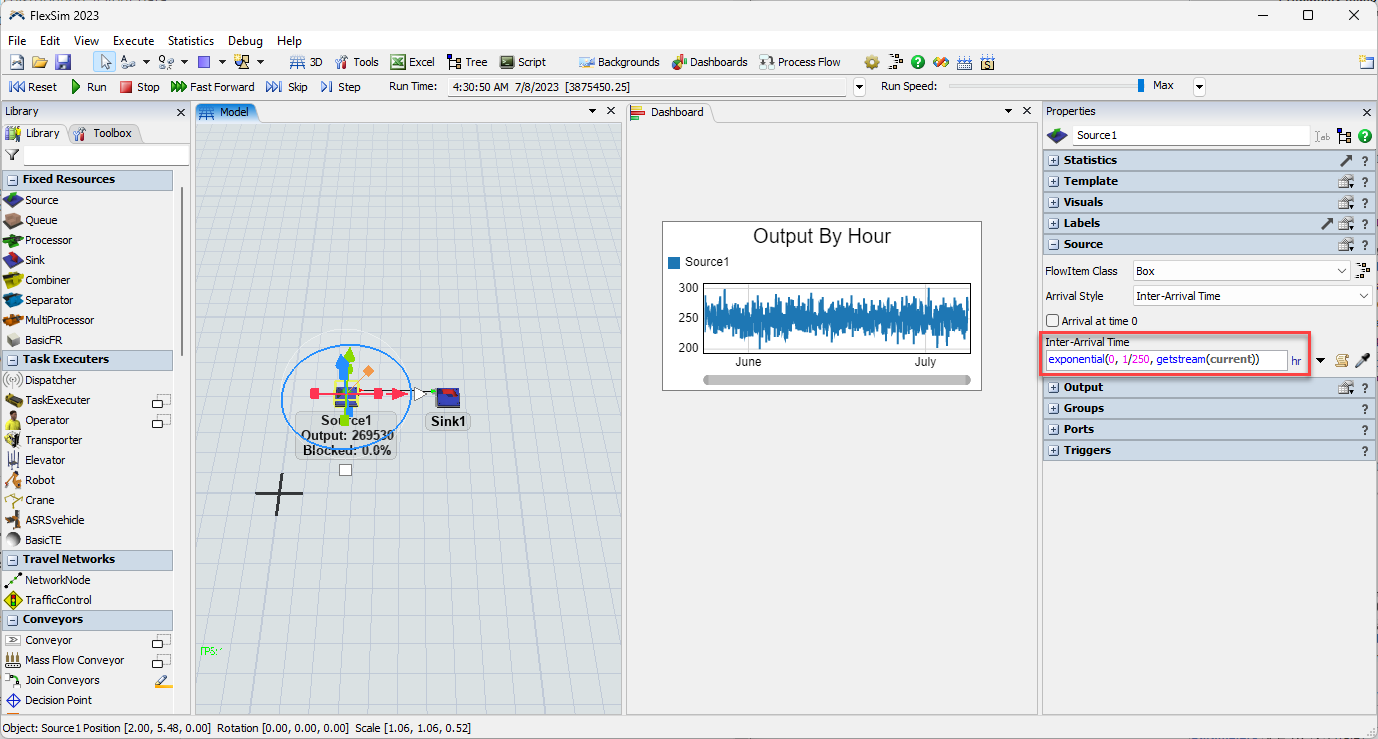
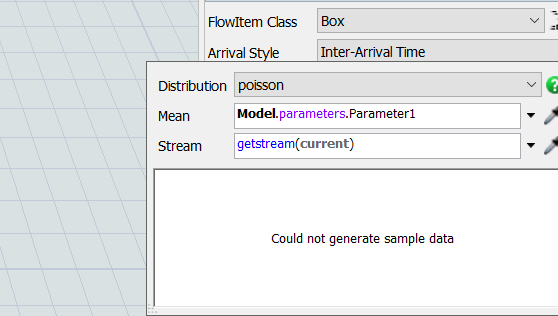
Exam. I have 250 Qty. of part in 1 hours and inter-arrival is Poisson distribution. So, How can I find Parameter (Mean of Poisson) to edit this case. Thank You.1684811581443.png

FlexSim 22.2.0
statistical distributiondistributionsdistribution parameters
· 2
5 |100000

Up to 12 attachments (including images) can be used with a maximum of 23.8 MiB each and 47.7 MiB total.

Jason Lightfoot avatar image Jason Lightfoot ♦ commented ·
For a Poisson process you can either work with the negative exponential interarrival times or the number of observations within a time period (Poisson). You may want to try the one for which you have most observations.
0 Likes 0 ·
Julie Weller avatar image Julie Weller commented ·

Hi @Anutt K, was one of Phil BoBo's or Arun Kr's or Joerg Vogel's answers helpful? If so, please click the "Accept" button at the bottom of the one that best answers your question. Or if you still have questions, add a comment and we'll continue the conversation.

If we haven't heard back from you within 3 business days we'll auto-accept an answer, but you can always unaccept and comment back to reopen your question.

0 Likes 0 ·
Phil BoBo avatar image
2 Likes"
Phil BoBo answered Phil BoBo edited

You don't need to use ExpertFit, OptQuest, or the Experimenter to solve your problem. The Poisson distribution is mathematically related to the Exponential distribution.

A poisson distribution describes the occurrences as a certain quantity per time period. An exponential distribution describes those same occurrences in terms of an inter-arrival time between occurrences (time per quantity). It's simply an inverse relationship.

"If for every t > 0 the number of arrivals in the time interval [0, t] follows the Poisson distribution with mean λt, then the sequence of inter-arrival times are independent and identically distributed exponential random variables having mean 1/λ." https://en.wikipedia.org/wiki/Poisson_distribution

If you have a Poisson distribution of "250 Qty. of part in 1 hours," then the scale (mean) parameter for the exponential distribution is 1/250 hours:

1684937306822.png

See also https://en.wikipedia.org/wiki/Exponential_distribution


1684937306822.png (131.0 KiB)
5 |100000

Up to 12 attachments (including images) can be used with a maximum of 23.8 MiB each and 47.7 MiB total.

Arun Kr avatar image
2 Likes"
Arun Kr answered

Hi @Anutt K ,

You can set up an optimizer job or use the experimenter to find out a solution closer to your mean value which produces 250 items in 1 hour. This can also be done using trial and error in your simulation model.

First, you need to set up a simple source and sink. In the source set the inter-arrival time as the poison distribution and set the mean value as a parameter from the parameters table or a variable that you can experiment with. The stop time of the model is 1 hour. The parameter shall be of continuous variable type and select the range of values for the mean. Let the performance measure be the sink input.

If you plan to use the optimizer use minimize objective and set the performance measure with a constraint <=250 units. By changing the parameter range you will be able to find a mean value that is closer to producing 250 units in 1 hour.


1684911250590.png


Regards,

Arun KR


1684911250590.png (15.8 KiB)
5 |100000

Up to 12 attachments (including images) can be used with a maximum of 23.8 MiB each and 47.7 MiB total.

Joerg Vogel avatar image
1 Like"
Joerg Vogel answered Joerg Vogel commented

Tool ExpertFit in Main Menu Statistics. But you get only parameters for a Poisson distribution, if your data fits. The tool suggest a best fitting distribution itself. On the other hand with just 250 events you can still use an empirical distribution from Toolbox.

· 2
5 |100000

Up to 12 attachments (including images) can be used with a maximum of 23.8 MiB each and 47.7 MiB total.

Anutt K avatar image Anutt K commented ·

I'm afraid I don't understand how to use empirical distribution, it look like we can input data from all data number and generate sample. So, In my case I konw in 1 hours flow item will arrival 250 item and I have distribution "Poisson" but I don't know parameter "mean".

So, How can we find data in this case


0 Likes 0 ·
Joerg Vogel avatar image Joerg Vogel Anutt K commented ·
@Anutt K, then do some tests to find empirically right fitting parameters. If you have an OptQuest license you can do it with a setup of boundaries.
1 Like 1 ·

Write an Answer

Hint: Notify or tag a user in this post by typing @username.

Up to 12 attachments (including images) can be used with a maximum of 23.8 MiB each and 47.7 MiB total.