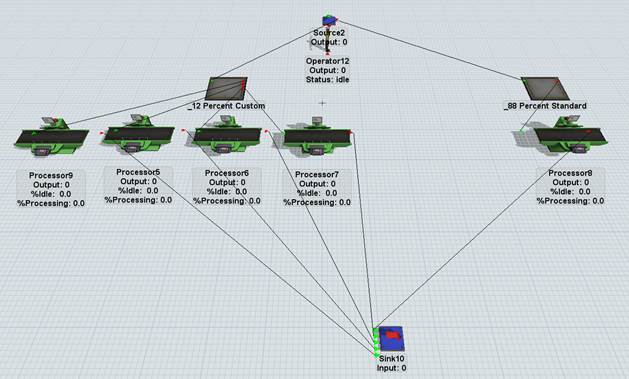
I want to be able to change the distribution from the queue named _12 Percent Custom. I need to send it to the processors by some sort of distribution, whether it be uniform, triangular, lognormal, etc.
Any help or direction would be appreciated.
I want to be able to change the distribution from the queue named _12 Percent Custom. I need to send it to the processors by some sort of distribution, whether it be uniform, triangular, lognormal, etc.
Any help or direction would be appreciated.
Setting flow rules based on distributions isn't a typical use case. Usually your historical data defining your flow can be broken down into percentages.
If you do find that you need to use a distribution to define your Send To Port logic, there are several factors to consider.
For a bounded distribution (having a defined minimum and maximum), things stay fairly simple. For instance, for your queue where the minimum port is 1, and the maximum port can be obtained via a call to nrop(), in your queue's Send To Port field, you could have the following:
- return duniform(1, nrop(current));
uniform() is a continuous distribution, and it doesn't really make sense to send an item through port 3.1415. This is why we used the discrete version, duniform().
For a triangular() distribution, things get just a bit trickier. Given a mode value, we then have to account for the fact that the triangular distribution is continuous. Our port numbers are discrete, so we need to convert the continuous value returned by triangular() to an integer:
- double mode = 2.3456;
- int port = triangular(1, nrop(current)+1, mode);
- return minof(port, nrop(current));
Here we're casting the result of the triangular() function call to an integer. Doing so strips the decimal value from the number, ie 1.4, 1.6, or 1.999 all become 1.
Why is triangular()'s max set as nrop()+1? Let's say nrop(current)==4. Our triangular distribution will return any value between 1 and 5, inclusive. By stripping off the decimal parts of the return values, we get our discrete values of 1, 2, 3, or 4. However, having our max set to 5 does allow triangular() to return 5 as a valid result, which won't make sense for our port numbers.
This is why we call minof() in the return statement. We are able to disallow the return of that max value (5) by only returning values up to the actual number of output ports.
How will you handle the infinite range of values that can be returned by an unbounded distribution? How will you put your own bounds on the result? Since you mentioned it, let's use the lognormal() distribution as an example.
The following graph shows the result of 10,000 calls of lognormal(1,2,1):
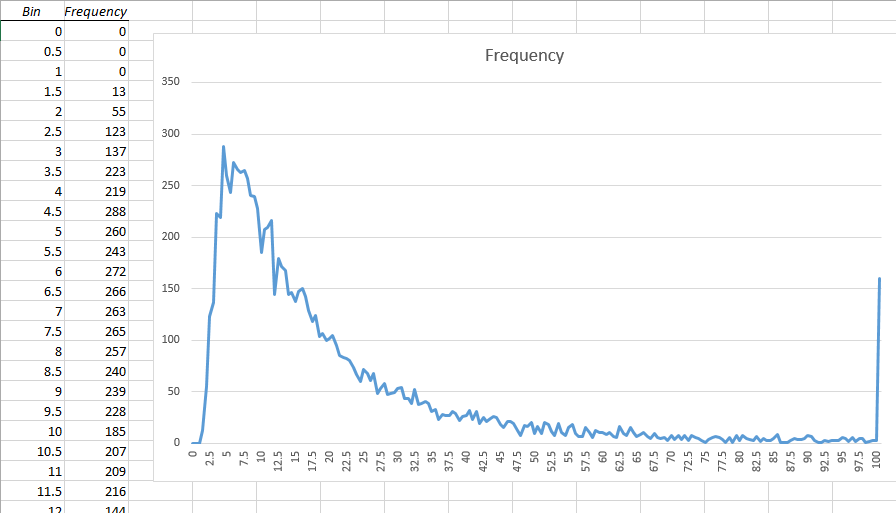
Notice that the chances of getting values between 3 and 15 are pretty good - there is a high frequency of results being in that range. Probabilities diminish as we move further right. At the far right of the graph is a spike. This is the "catchall" bin - with this particular graph of the results, any values greater than 100 are lumped in that far right bin. The probability of any single value diminishes as we move to the right, but the power of the long tail is evident - there are a lot of values returned that are out of the bounds of the bins that I defined in Excel. Statistically, that long tail extends infinitely, with ever diminishing probabilities.
How should we equate these results with port numbers in FlexSim? There are several ways you could approach this problem - below is just one example.
Choose a range of values that capture the portion of the curve's shape that you're interested in. In this graph, our minimum value is 1, and a max of 101 adequately captures the shape of this curve for our purposes. If we ever roll the lognormal() dice and get a value greater than 101, we'll just roll the dice again. This essentially takes any remaining probability of values greater than 101 and spreads that probability across the portion of the curve that we're keeping.
Now we have to convert these values, 1-101, into port numbers 1-4 (keeping with the example where nrop(current)==4):
- int minval = 1;
- int maxval = 101;
- double val = lognormal(1,2,1);
- while (val >= 101) {
- val = lognormal(1,2,1);
- }
- int range = maxval-minval;
- int port = (val-minval)*nrop(current)/range;
- port = minof(port+minval, nrop(current));
- return port;
The following graph shows the histogram of values produced by 10,000 iterations of the above code:
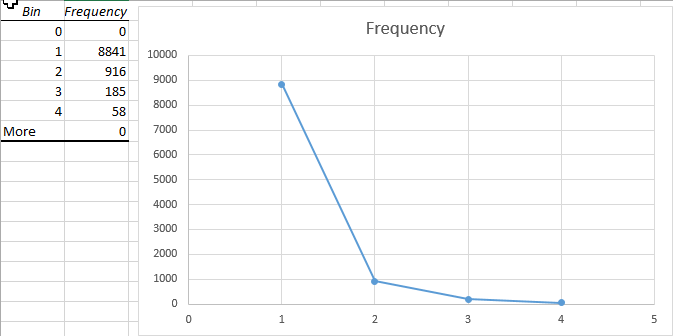
As you can see we've pretty well approximated the lognormal() curve as best we can using just 4 bins for the 4 output ports.
5 People are following this question.
FlexSim can help you understand and improve any system or process. Transform your existing data into accurate predictions.
FlexSim is a fully 3D simulation software environment. FlexSim can be used to simulate any process in any industry.
FlexSim®, FlexSim Healthcare™, Problem Solved.®, the FlexSim logo, the FlexSim X-mark, and the FlexSim Healthcare logo with stylized Caduceus mark are trademarks of FlexSim Software Products, Inc. All rights reserved.
May we collect and use your data?
Learn more about the Third Party Services we use and our Privacy Statement.May we collect and use your data to tailor your experience?
Explore the benefits of a customized experience by managing your privacy settings for this site or visit our Privacy Statement to learn more about your options.