aa.fsm4.26(n).zi
I want to know the status of my agv throughout the process
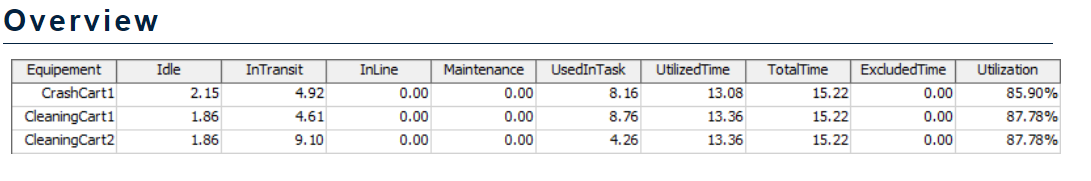
like this, but I don't know how to open this table
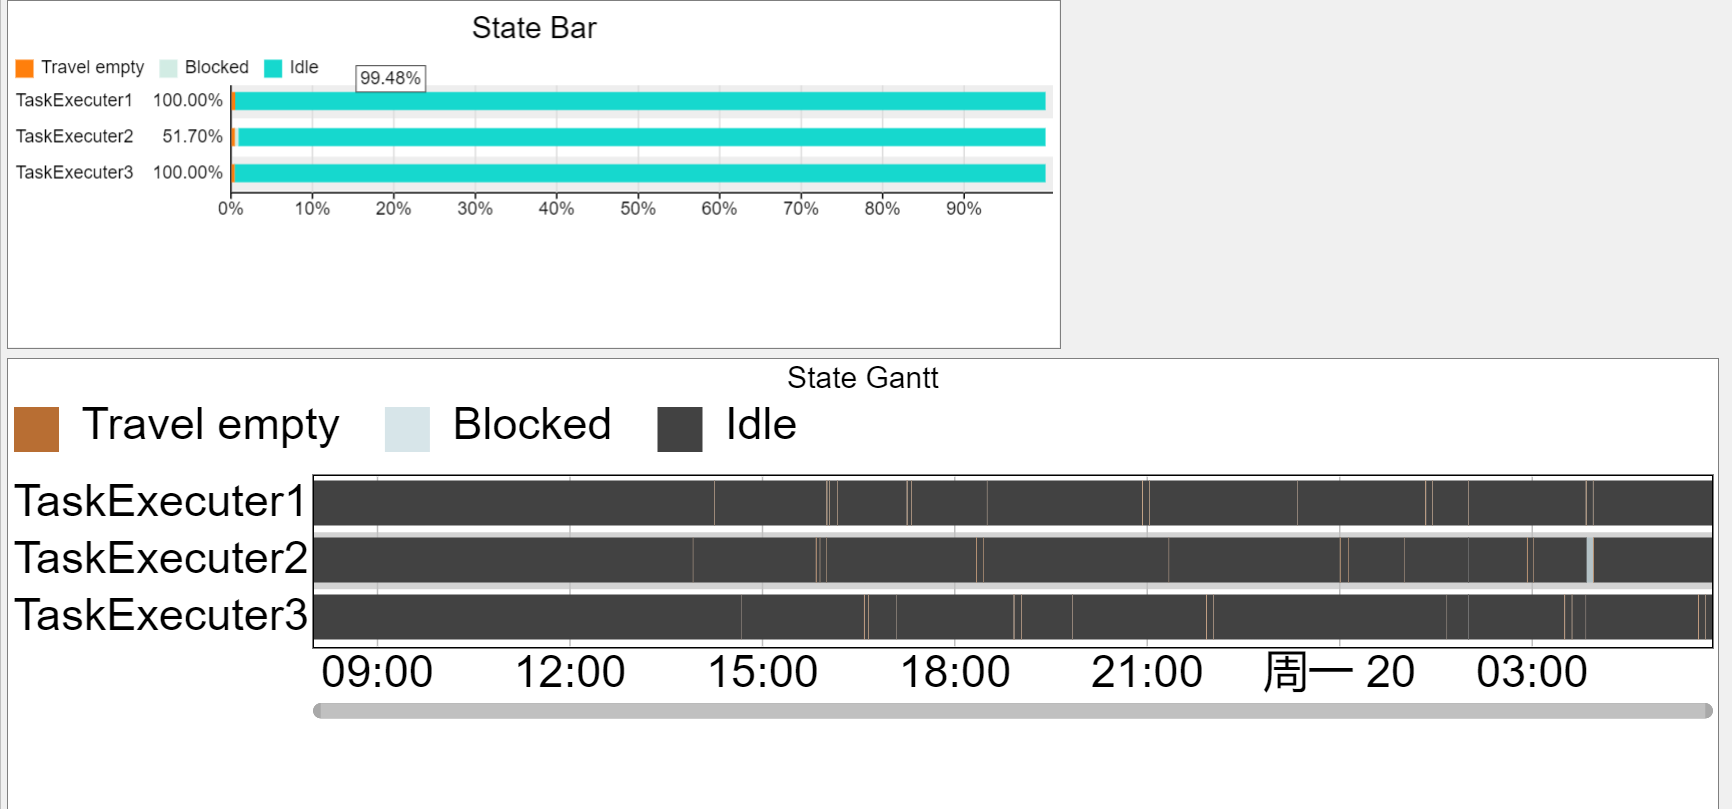
I know there are Gantt charts that can present the status, but I want to be able to present the status in a form
aa.fsm4.26(n).zi
I want to know the status of my agv throughout the process
like this, but I don't know how to open this table
I know there are Gantt charts that can present the status, but I want to be able to present the status in a form
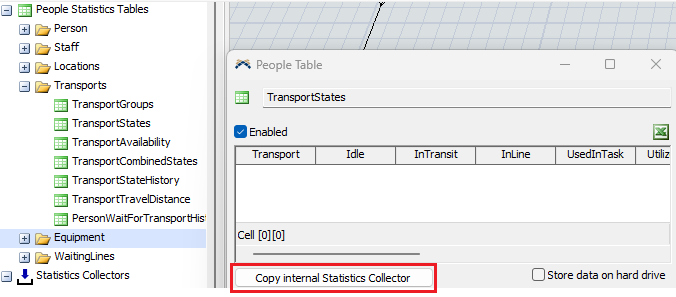
Your first screenshot shows a state table from the People/Healthcare module. It won't work for task executers or other objects from the default environment out of the box, since the healthcare environment uses different state profiles.
The necessary adjustments to get it to work are relatively minor though. First, click on the marked button to create a copy of the Statistics Collector that stores the data for this table.
In the Statistics Collector you have to change two things. On the Events Tab, the state profiles that the collector should use are determined in the member_profiles label. Open the code and adjust it, so it returns an array of the state profile nodes of the objects you want to track. I used a group to store which objects those are. (You can of course also the variable names to something more fitting. I just left the default names.)
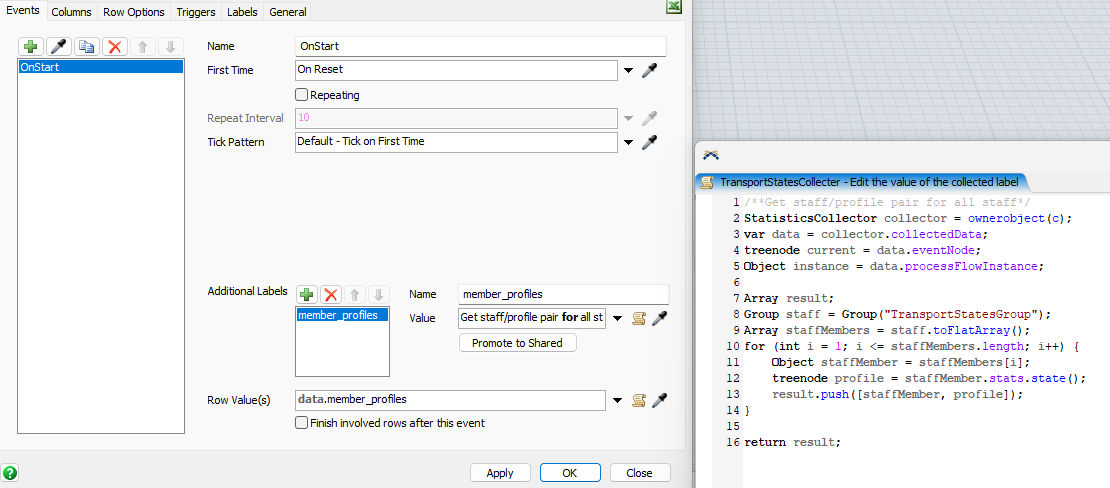
The second adjustment must be made in the Set Values field of the States column on the Columns tab. Instead of reading the states from the People Settings, I manually create an array that contains the states that should be tracked and use a State Table to determine their display names and whether they are counted as active or inactive in the utilization calculation or whether they are excluded.
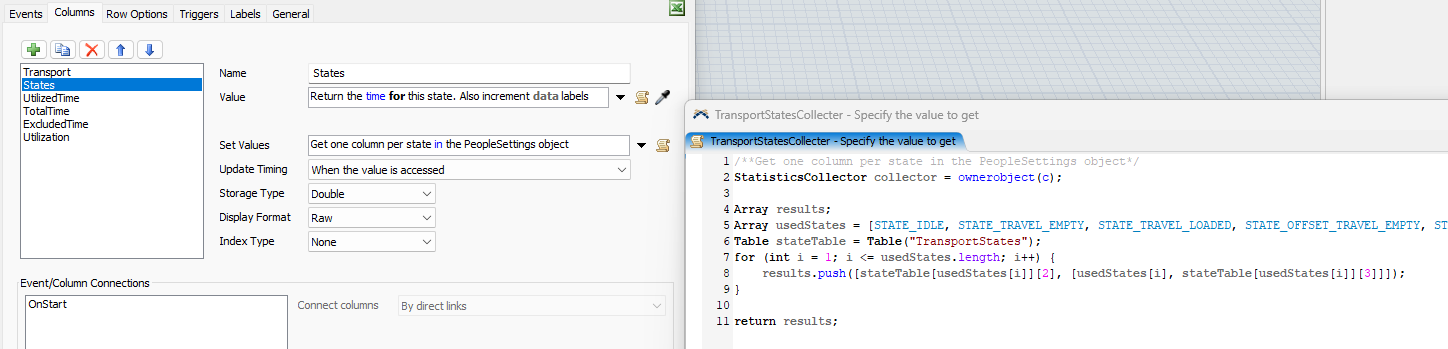
And that's all. The Statistics Collector will now create and update a table that shows the times spend in the specified states and the resulting utilization. (You can view the table from the General tab of the collector.)

14 People are following this question.
FlexSim can help you understand and improve any system or process. Transform your existing data into accurate predictions.
FlexSim is a fully 3D simulation software environment. FlexSim can be used to simulate any process in any industry.
FlexSim®, FlexSim Healthcare™, Problem Solved.®, the FlexSim logo, the FlexSim X-mark, and the FlexSim Healthcare logo with stylized Caduceus mark are trademarks of FlexSim Software Products, Inc. All rights reserved.
May we collect and use your data?
Learn more about the Third Party Services we use and our Privacy Statement.May we collect and use your data to tailor your experience?
Explore the benefits of a customized experience by managing your privacy settings for this site or visit our Privacy Statement to learn more about your options.