Hi there,
Is it possible to make a State Gantt chart display a custom state? I want to define a state called "WaitForManager" and then i want this to be displayed by the State Gantt.
Any assistance would be appreciated.
Hi there,
Is it possible to make a State Gantt chart display a custom state? I want to define a state called "WaitForManager" and then i want this to be displayed by the State Gantt.
Any assistance would be appreciated.
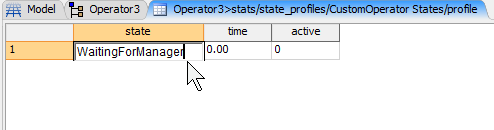
There is a template for custom states within the MultiProcessor object in the library. So if you drag one out into the model. You can get to the object's tree view by right clicking the object and selecting Explore Tree View. If you expand the object in the tree view, under stats>state_profiles>MultiProcessor States>profile, "profile contains a table of custom states. You can select the "state_profiles" and copy it. Then open your operator's tree view, and expand stats. Then right-click on stats, and select node>Insert Into. This will create a blank node. You can select that node, and paste the "state_profiles" into it. Change MultiProcessor States to something else like CustomOperator States. And then you can right click on the "profile" node, and select Explore > As Table. This brings up a table of your custom states. You can rename them, or add or remove as many rows/states as you want (just leave the time and active alone).

In your model you can use the "setstate()" command, with the operator object as your first parameter, the state number (the row of your state from a 0-based index) and the last number being the state profile you are setting.
So if you are using the above example your setstate command would be something like this:
setstate(current,0,1)
Where current is the operator, 0 is the first state in the list of states, and 1 is the profile your are using.
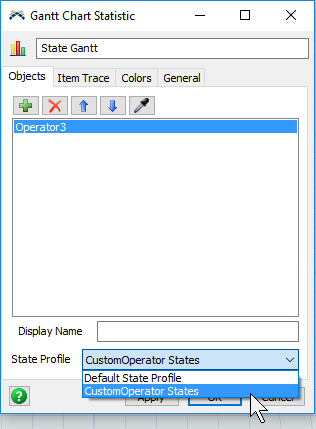
Finally to display your custom state in the Gantt Chart, open up the State Gantt chart's properties, and make sure the Object list includes your operator with the custom states. At the bottom under the state profile dropdown menu, you should be able to select your CustomOperator States or whatever you named the profile.
I'm using the info from this older thread to implement custom state profiles in my model (version 23.0).
I assume that "time" is the cumulative time spent in a given state that's automatically set and reset during the simulation run, but what does "active" refer to? The answer above says to leave it alone, but if this refers to the "Analysis" column of the state table (ex. blank/utilized/excluded), I definitely want to set this correctly so that I can perform the state analysis. Does anyone happen to know? Thanks!
7 People are following this question.
FlexSim can help you understand and improve any system or process. Transform your existing data into accurate predictions.
FlexSim is a fully 3D simulation software environment. FlexSim can be used to simulate any process in any industry.
FlexSim®, FlexSim Healthcare™, Problem Solved.®, the FlexSim logo, the FlexSim X-mark, and the FlexSim Healthcare logo with stylized Caduceus mark are trademarks of FlexSim Software Products, Inc. All rights reserved.
