question

GRodea avatar image
0 Likes"
GRodea asked Jason Lightfoot commented

Dashboard activities time breakdown for the task executers / operators

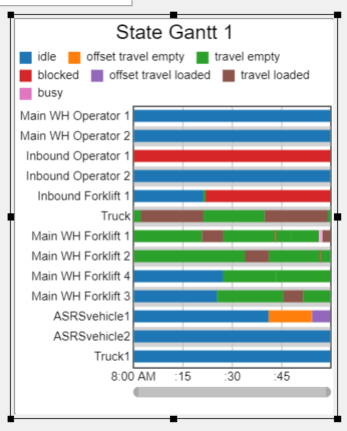
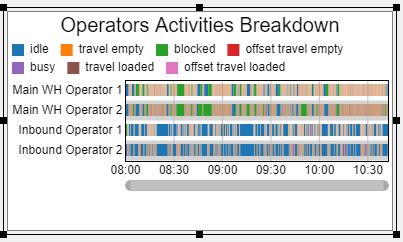
In Dashboard2/Time Plot I tired to organize a graph to evaluate how much time a task executer or operator is performing an specific task, for example: loading, unloading, moving with a box, moving empty, idle but I could not achieve.

Could you please show me how can I achieve it?

WH model.fsm

FlexSim 23.1.2
operatortaskexecutoractivities breakdown
wh-model.fsm (412.8 KiB)
· 1
5 |100000

Up to 12 attachments (including images) can be used with a maximum of 23.8 MiB each and 47.7 MiB total.

1 Answer

Julie Weller avatar image
0 Likes"
Julie Weller answered Julie Weller commented

Hi @GRodea! If you go to State -> State Gantt in the library for Dashboards and add all your Operators and TE's, it will automatically add all those states for you:

1692712011903.png

Does that solve your problem?


1692712011903.png (44.0 KiB)
· 3
5 |100000

Up to 12 attachments (including images) can be used with a maximum of 23.8 MiB each and 47.7 MiB total.