Is it possible to create a histogram and line graph in Custom GUI? I would like to create a similar histogram and line graph based on the data below
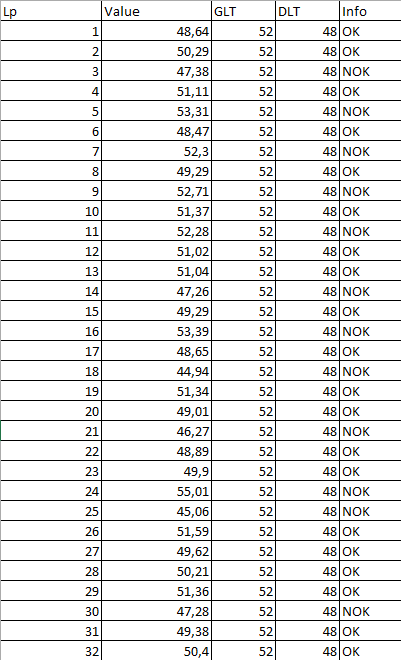
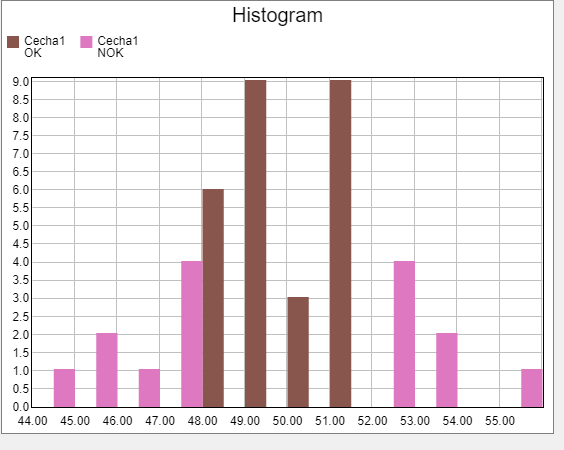
Histogram
Is it possible to create a histogram and line graph in Custom GUI? I would like to create a similar histogram and line graph based on the data below
Histogram
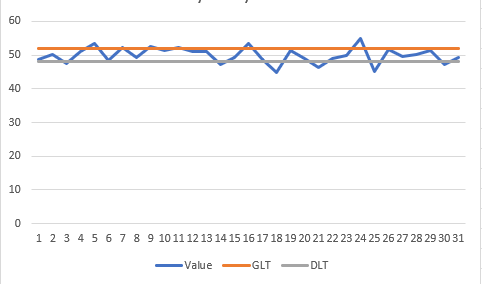
Are you asking for a single chart that shows both the histogram and the line chart? If so, I'm not sure I follow what you want to do. In a histogram, the X axis shows the range of data and the Y axis shows the count of data. in various sub ranges. In your line chart, the X axis shows the number of data points (1 to N) and the Y axis shows the range of data. They aren't really compatible in the same chart for that reason.
But maybe I misunderstand your question. Can you describe more what you would like to do?
15 People are following this question.
FlexSim can help you understand and improve any system or process. Transform your existing data into accurate predictions.
FlexSim is a fully 3D simulation software environment. FlexSim can be used to simulate any process in any industry.
FlexSim®, FlexSim Healthcare™, Problem Solved.®, the FlexSim logo, the FlexSim X-mark, and the FlexSim Healthcare logo with stylized Caduceus mark are trademarks of FlexSim Software Products, Inc. All rights reserved.
May we collect and use your data?
Learn more about the Third Party Services we use and our Privacy Statement.May we collect and use your data to tailor your experience?
Explore the benefits of a customized experience by managing your privacy settings for this site or visit our Privacy Statement to learn more about your options.