I have a Milestone Collector set up and I'm using it to measure durations in a Box-Plot chart. I also wanted to see the same data in a different chart format, so I added a Histogram chart using the exact same interval.
However, when I look at the charts, they do not match each-other, and when I pull up the data tables, they are not the same at all.
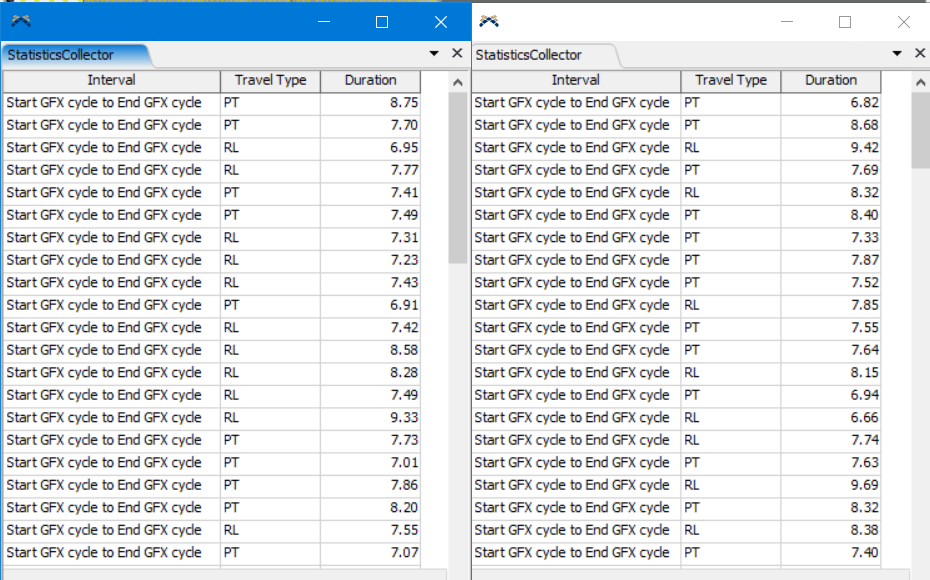
In fact, one data table has 124 rows, and the other one has only 44 rows.
How do I make sure there is only one data set and both charts are reading from the same one?
Thanks
(The model is confidential, but I can send it do FlexSim support if needed.)
