question

Chandler avatar image
0 Likes"
Chandler asked Chandler commented

Process Flow Activity Statistics Chart is Empty (Healthcare)

This is the same for every model I try, so I'm just sharing the last version of the model I was given in the Healthcare Training session because it works and is built by-the-book. I'm looking to use this feature to track which activities are getting deadlocked in a much larger model than the one attached, it's easier to have some output than to try to locate visually.

---

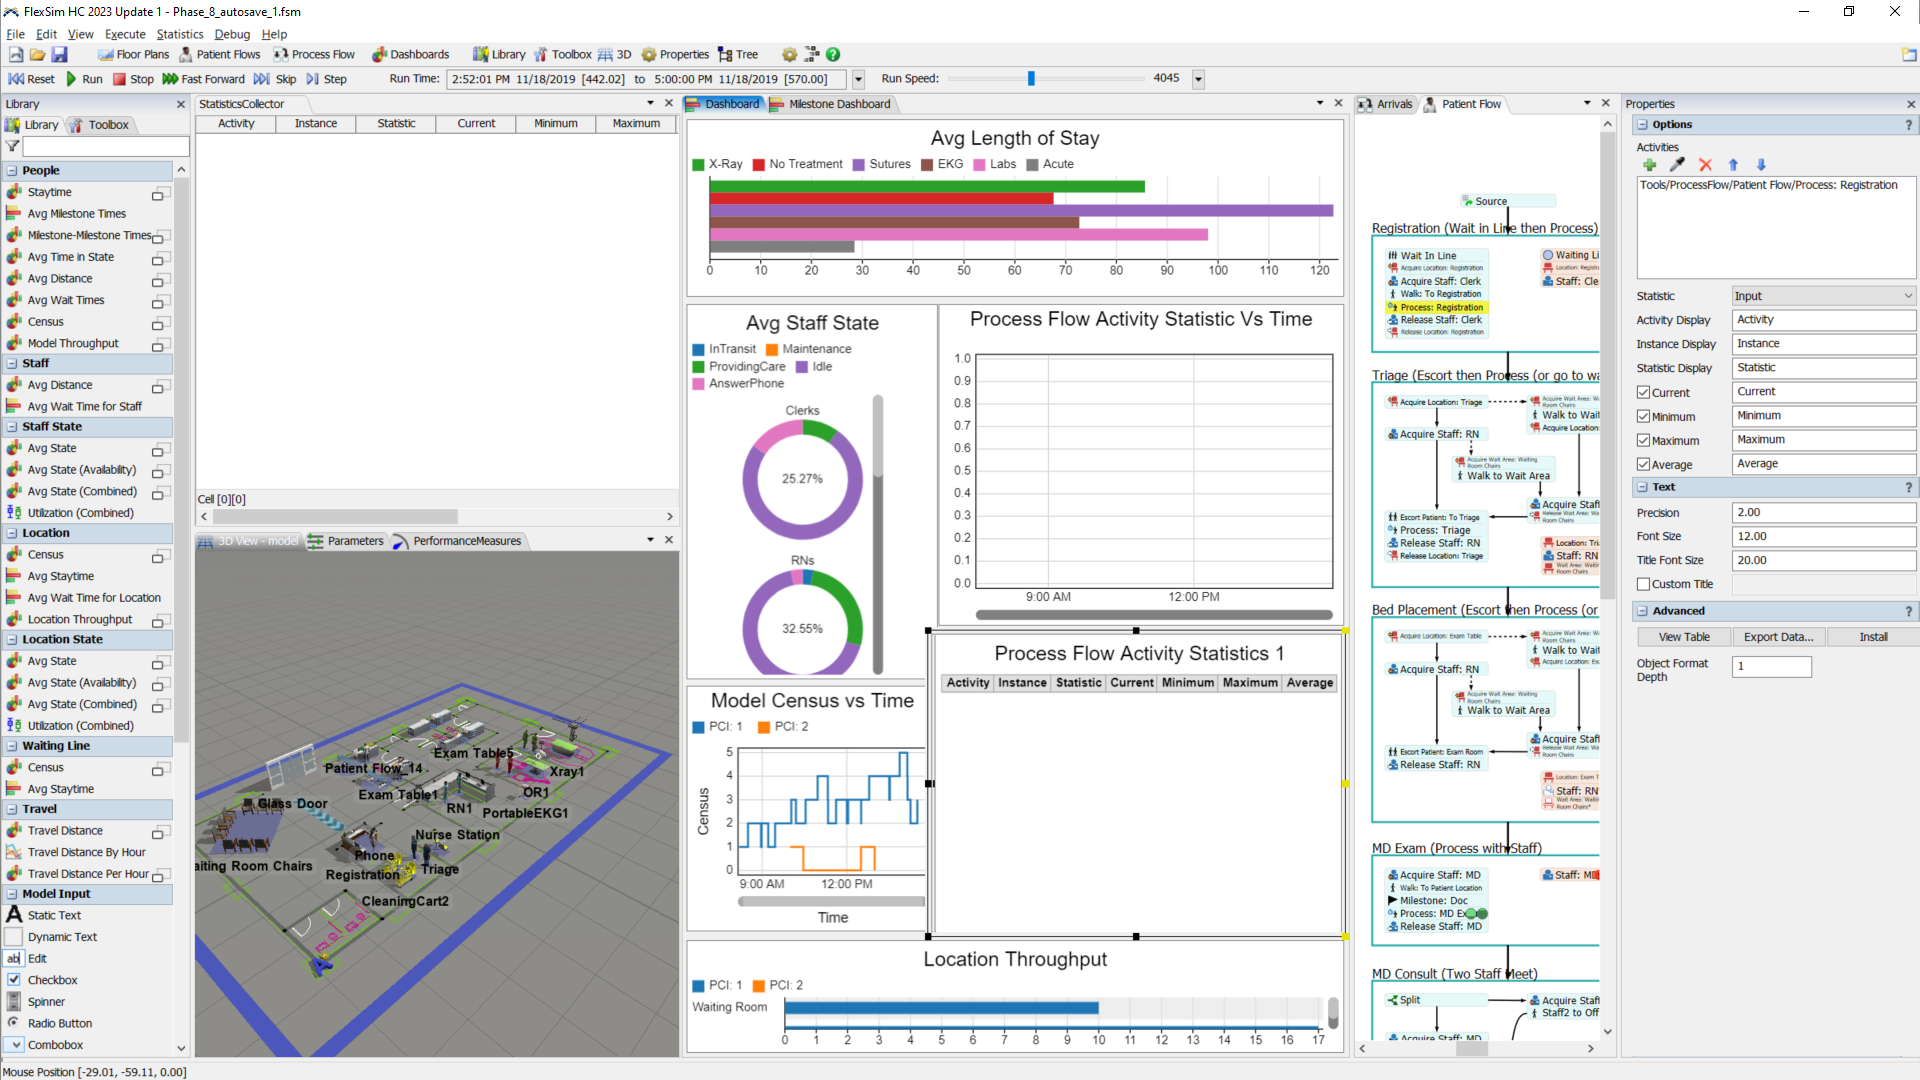
So I put the Process Flow Activity Statistics Chart template into my dashboard, and select an activity early in the process, to see if I can watch the content over time and determine which activities are getting backed up.

The chart does change once I have an activity added to the group (the table shows headers) but I see no output on the chart/table, nor in the internal table that I can view by selecting "View table" under "Advanced".

In the attached screenshot, I have both of these charts set up to read the Process: Registration activity, but nothing comes through.

What do I need to do to make this work?

1698074079473.pngPhase_8-activity_statistics.fsm

FlexSim 23.1.2
statisticsactivity
5 |100000

Up to 12 attachments (including images) can be used with a maximum of 23.8 MiB each and 47.7 MiB total.

1 Answer

·
Felix Möhlmann avatar image
1 Like"
Felix Möhlmann answered Chandler commented

The activity statistics only work with fixed Process Flow instances (assigned to fixed resources in the model). Even if it did, you would get the content per instance/patient, not the sum over all instances.

To get the current total content you have to adjust the Statistics Collector (install it through the properties or start from scratch) into what is essentially the collector behind the Content chart of the default environment.

phase-8-activity-statistics_1.fsm

The Statistics Collector listens to the entry and exit events of all activities in the group. It creates a persistant row for each one. Each row is assigned a label in the On Row Updating trigger whose value is either incremented or decremented depending on which event triggered. The value of that value is then written to the Current column.


· 3
5 |100000

Up to 12 attachments (including images) can be used with a maximum of 23.8 MiB each and 47.7 MiB total.

Chandler avatar image Chandler commented ·

Ok yes that's pretty useful. Would love to see it as a chart over time if possible.

How would I make a statistics collector that creates a new row for each activity each time it is updated? I think that table would look something like this (etc)

1698162873465.png

I'm not great with the statistics collectors and I'm sure I don't know how to reference a value from the last row with the same value for Activity... but that's what I think I would need to do.

0 Likes 0 ·
1698162873465.png (14.3 KiB)
Felix Möhlmann avatar image Felix Möhlmann Chandler commented ·

All you have to do for that is to:

- add a column that collects the current time

capture1.png- set the rows to be "finished" after the events

capture2.png- check the option to keep the row value and, importantly, row labels of finished rows.

capture3.png

The previous value is stored in the row label, which is unique per row value. So the next time the same row value (activity) appears, the "delta" label that is defined on the events tab is added to the label value (either +1 or -1) and the new value is written to the row.

phase-8-activity-statistics-1.fsm

1 Like 1 ·
capture1.png (5.7 KiB)
capture2.png (1.8 KiB)
capture3.png (5.1 KiB)
Chandler avatar image Chandler Felix Möhlmann commented ·

Oh that's easy. And works perfectly. Thanks!

0 Likes 0 ·

Write an Answer

Hint: Notify or tag a user in this post by typing @username.

Up to 12 attachments (including images) can be used with a maximum of 23.8 MiB each and 47.7 MiB total.