question

Mohamed Eldakroury avatar image
0 Likes"
Mohamed Eldakroury asked cyc edited

Exclude certain states from a stay time chart

Hello,

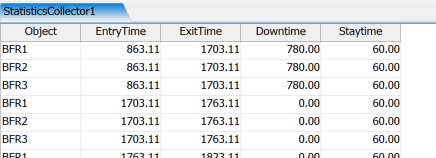
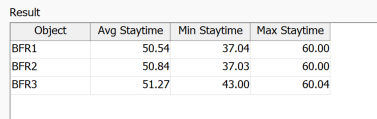
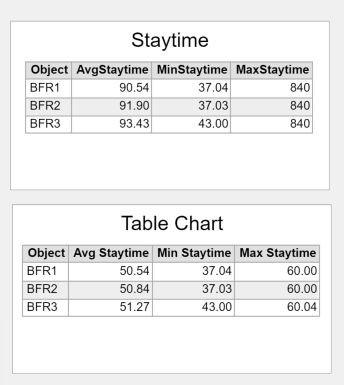
I am trying to show the staytime for my custom basic fixed resource. However, the average and maximum staytimes are not what I'm looking for due to including downtimes and breakdown times. is there a simple way to exclude states form charts? I read a couple of posts here on the forum that talk about doing this using code but I'm wondering if there is a simple way to unselect/exclude some states from charts.


ExcludeStatesFromCharts.fsm

FlexSim 23.2.0
chartsstaytime
· 2
5 |100000

Up to 12 attachments (including images) can be used with a maximum of 23.8 MiB each and 47.7 MiB total.

Joerg Vogel avatar image Joerg Vogel commented ·
@Mohamed Eldakroury , a staytime is per default an interval between entry and exit of an item. Any other composition like time in a state is a task of a calculated table.
0 Likes 0 ·
Jason Lightfoot avatar image Jason Lightfoot ♦ commented ·

Hi @Mohamed Eldakroury, was Jeanette F's answer helpful? If so, please click the "Accept" button at the bottom of their answer. Or if you still have questions, add a comment and we'll continue the conversation.

If we haven't heard back from you within 3 business days we'll auto-accept an answer, but you can always comment back to reopen your question.

0 Likes 0 ·

1 Answer

·
Jeanette F avatar image
0 Likes"
Jeanette F answered cyc edited

Hello @Mohamed Eldakroury,

Would it work to look at the time that the processor spends in states that occur when an item is in the processor and aggregate those times? This would be the total time and you can calculate the average time from there as well. You would not have the min and max stay time in this case.

Edit:

I added that the MTBF MTTR and Timetable set a label on the item in the down object with the duration of the downtime (if there is an item). In the statistics collector it tracks the entry time, exit time, and downtime. The stay time is calculated by removing the downtime. I then use a calculated Table to calculate the avg, min, and max stay time.

1709670659688.png

1709670670315.png

In the following you can see the default stay time takes into account the downtime and the new chart does not.

1709670680951.png

excludestatesfromcharts_1.fsm


· 3
5 |100000

Up to 12 attachments (including images) can be used with a maximum of 23.8 MiB each and 47.7 MiB total.

Mohamed Eldakroury avatar image Mohamed Eldakroury commented ·

Thank you! I'll attempt to do it with calculated tables

0 Likes 0 ·
Mohamed Eldakroury avatar image Mohamed Eldakroury commented ·

@Jeanette F Somehow I just saw your answer now. I was getting ready to post a question about using calculated tables to do what you've mentioned here and I searched the forum and found your answer!


Your answer makes perfect sense and that's exactly what I wanted to do. I'll try it out and let you know. Thank you, that helps a lot!

0 Likes 0 ·
cyc avatar image cyc commented ·

Thanks for the help @Jeanette F, this actually works.

However, I ran into another problem. I'd like to see Schduled Down Time, not Downtime from MTBF MTTR.

Because my Model has a Time table set up, and the function I want to achieve is that when my material stays on the processor, it must not be in the Scheduled Down state in order to calculate the Staytime.

Can any expert help me? Thank you so much.

0 Likes 0 ·

Write an Answer

Hint: Notify or tag a user in this post by typing @username.

Up to 12 attachments (including images) can be used with a maximum of 23.8 MiB each and 47.7 MiB total.