question

j08j avatar image
0 Likes"
j08j asked Felix Möhlmann commented

Coding in flexscript

I have some questions about flexscript coding, how can I execute these steps using flexscript?

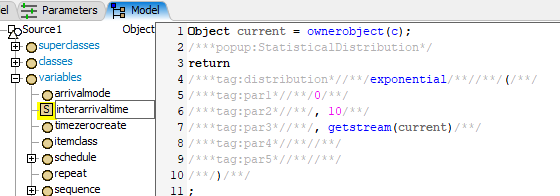
1. Modify the parameters of exponential distribution in the source property.截圖-2024-06-13-下午25557.png

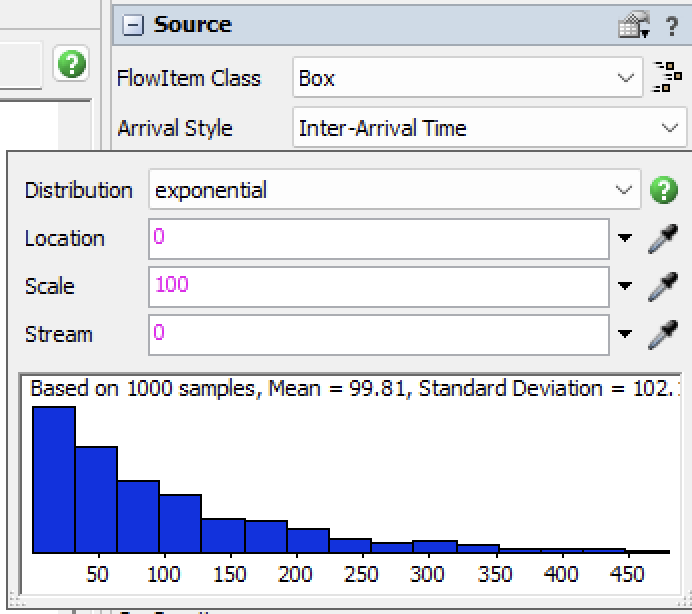
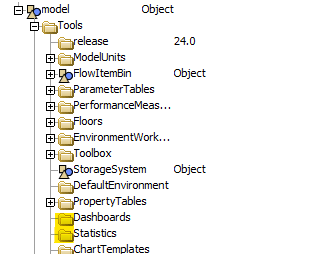
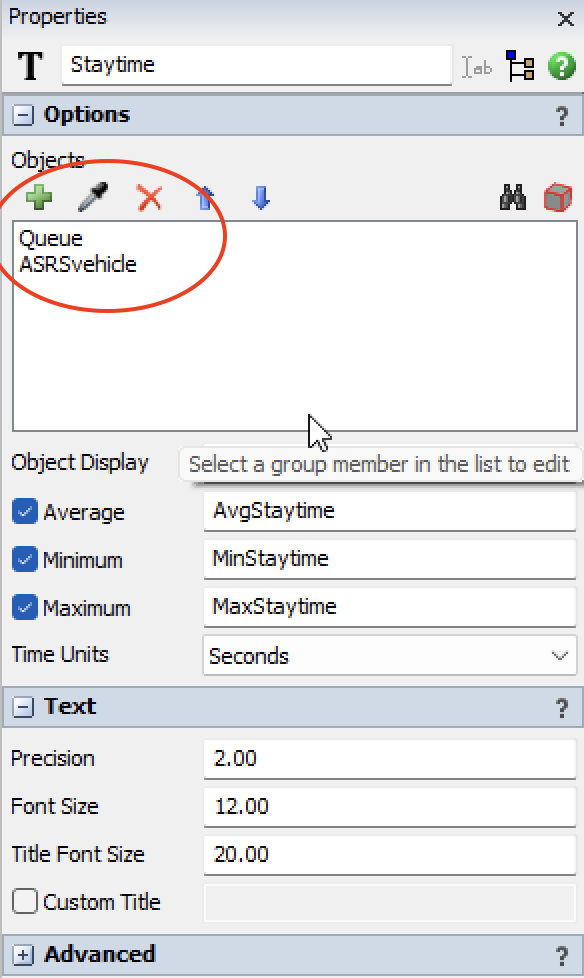
2. Add a dashboard that expresses staytime in the form of a table, and add objects Queue and ASRSvehicle.截圖-2024-06-13-下午25433.png截圖-2024-06-13-下午25506.png

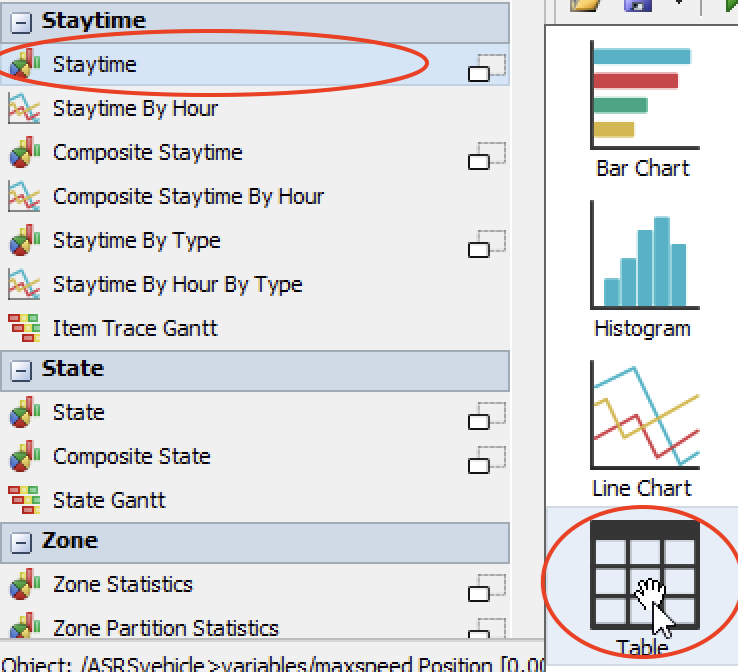
3. A piece of code to clear dachbord. I hope that every time the program is executed, the old dashboard will be deleted and rebuilt instead of adding new dashboards all the time.

Thanks for your help.

FlexSim 24.0.2
flexscriptdashboardssourcecode
· 1
5 |100000

Up to 12 attachments (including images) can be used with a maximum of 23.8 MiB each and 47.7 MiB total.

j08j avatar image j08j commented ·

Can anyone help me solve this problem?

I really appreciate it.

0 Likes 0 ·

1 Answer

·
Felix Möhlmann avatar image
0 Likes"
Felix Möhlmann answered Felix Möhlmann commented

1) Either set the source to use parameters instead of fixed values and then change those parameters. Or edit the text of the code node ("macth" and "replace" methods of the string class).

capture1.png

2) "applicationcommand("adddashboard")" to add a new dashboard. For the rest see the link.

https://answers.flexsim.com/questions/148499/how-to-add-a-output-bar-chart-in-the-dashboard-usi.html

3) Just delete the subnodes of the "Dashboards" and "Statistics" in the Tools folder.

capture2.png


capture1.png (23.1 KiB)
capture2.png (11.6 KiB)
· 5
5 |100000

Up to 12 attachments (including images) can be used with a maximum of 23.8 MiB each and 47.7 MiB total.

j08j avatar image j08j commented ·

I tried following the reference link:

Object dashview=views().find("active>Documents/Dashboard/1+/~");
Object chartview=views().find("viewslibrary/Dashboard/Output/ThroughputTable");
Object chart=function_s(dashview,"createGraphWindow",chartview,1);
Group group = getvarnode(chart,"replacements").subnodes["Objects"].value;
group.addMember(Model.find("Queue"));

but no success, and get an error on Line 4.

截圖-2024-06-18-上午85111.png

Can you help me modify it?

Thanks a lot.

0 Likes 0 ·
Felix Möhlmann avatar image Felix Möhlmann j08j commented ·

The location of the chart definitions changed. You just have to adjust line 2.

Object chartview=maintree().find("project/exec/globals/ChartTemplateDefinitions/Output/ThroughputBar");

Check the path shown above to find the names of other chart types.

0 Likes 0 ·
j08j avatar image j08j Felix Möhlmann commented ·

Thanks, it executed it successfully.

I have another question. Currently, it displays Throuput information. How can I change it to calculate WIP?

0 Likes 0 ·
Show more comments

Write an Answer

Hint: Notify or tag a user in this post by typing @username.

Up to 12 attachments (including images) can be used with a maximum of 23.8 MiB each and 47.7 MiB total.