question

fiz avatar image
0 Likes"
fiz asked Logan Gold commented

dashboards for tokens

Hi, for statistics collector, design of dashboard i realise the templates provided are not really token friendly but rather it references to objects. is there template i can follow for me to customise statistics collector to do the following?
1719578847790.png

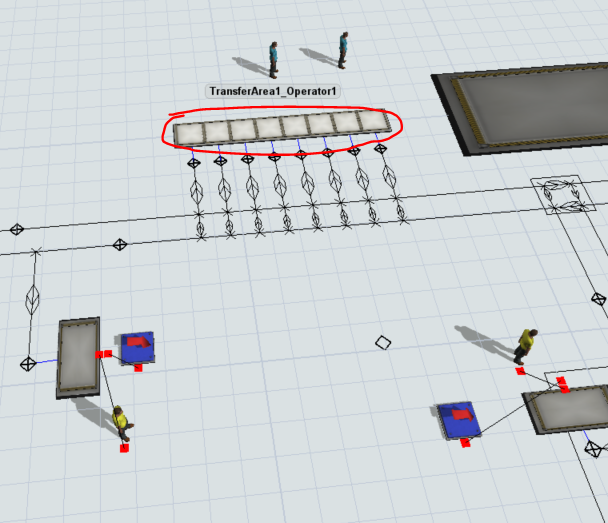
track the total output per hour per each different delivery station from the areas above combined? as the outputs are all the same items but with different delivery stations hence im unable to track it.

1719579096044.png

the average wait time (by type/transferareaID) for each of the delivery station above as they are pulling tokens to them and have to wait for the tokens to arrive.

1719580605297.png

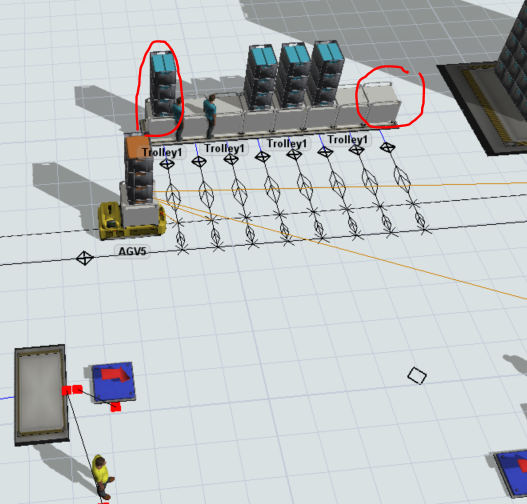
also, i would like to compute the avg staytime of delivery orders on the slots, as using the staytime of the queue object will not be an accurate representation of staytime as trolleys are replenish with orders.

FlexSim 21.1.5
dashboardstoken dashboard
1719578847790.png (154.8 KiB)
1719579096044.png (58.4 KiB)
1719580605297.png (163.2 KiB)
· 1
5 |100000

Up to 12 attachments (including images) can be used with a maximum of 23.8 MiB each and 47.7 MiB total.

Logan Gold avatar image Logan Gold ♦♦ commented ·

Hi @fiz, was Felix Möhlmann's answer helpful? If so, please click the "Accept" button at the bottom of their answer. Or if you still have questions, add a comment and we'll continue the conversation.

If we haven't heard back from you within 3 business days we'll auto-accept an answer, but you can always comment back to reopen your question.

0 Likes 0 ·

1 Answer

Felix Möhlmann avatar image
0 Likes"
Felix Möhlmann answered Felix Möhlmann edited

You can use the "Output By Hour By Type" chart and set it to differentiate based on the delivery destination (must be a number or string label on the trolleys).

To track wait times/staytimes I would suggest to use Milestone activities in the Process Flow. A Milestone Collector can collector timestamps of when tokens enter these activities (add the collector first, so the activities are linked to it automatically when added). A "Milestone Interval (By Type)" chart can then display a box plot of the times between different milestones.

5 |100000

Up to 12 attachments (including images) can be used with a maximum of 23.8 MiB each and 47.7 MiB total.