question

Christophe Compondu avatar image
0 Likes"
Christophe Compondu asked Matthew Gillespie answered

HC - Utilization by Hour charts

I would like to make a dashboard chart that shows utilization per hour of a resource group, but I can't find that in the chart options.

FlexSim HC 5.0.12
dashboardshcutilizationby hour
5 |100000

Up to 12 attachments (including images) can be used with a maximum of 23.8 MiB each and 47.7 MiB total.

1 Answer

·
Matthew Gillespie avatar image
0 Likes"
Matthew Gillespie answered

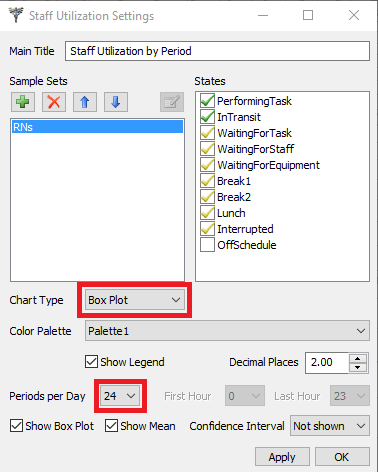
This option is only available on a Box Plot chart. Once you've changed your chart to be a box plot you get the option to specify the Periods per Day.

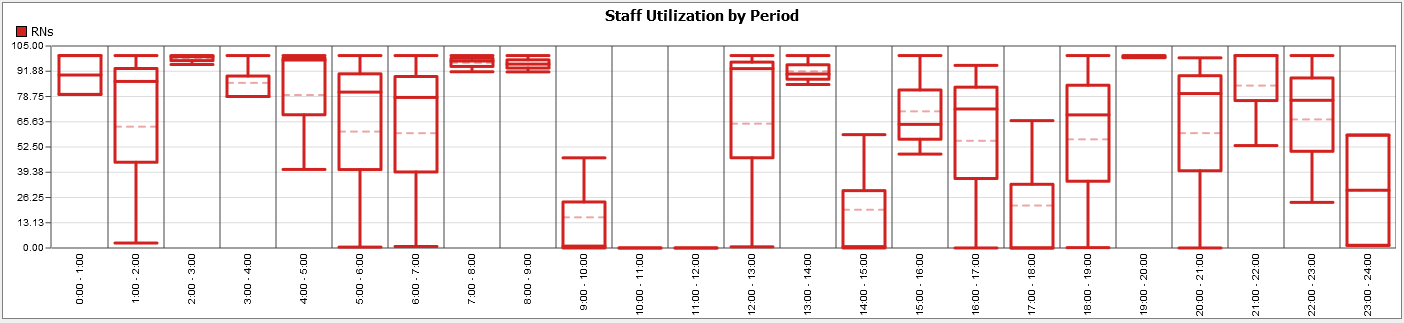
Attached is a model with a working Utilization by Hour chart for the resource group.


chartoptions.png (15.5 KiB)
utilization.png (27.7 KiB)
5 |100000

Up to 12 attachments (including images) can be used with a maximum of 23.8 MiB each and 47.7 MiB total.

Write an Answer

Hint: Notify or tag a user in this post by typing @username.

Up to 12 attachments (including images) can be used with a maximum of 23.8 MiB each and 47.7 MiB total.