question

Michael O'Connell avatar image
0 Likes"
Michael O'Connell asked Jacob Gillespie answered

Utilizations by discrete time periods

utilization-by-period.fsm

v16.1

I'm modeling a scenario where production increases in steps over a number of years. Assets might need to be added for later years that are not needed for earlier years. I want to be able to capture utilizations for the individual years.

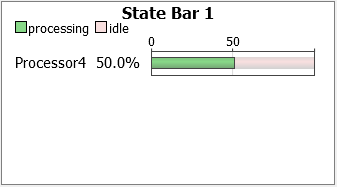
The attached example shows a source creating 1 item every day. The processor's process time is 12 hours, so the utilization gets very quickly to 50%. At 100 days (time 2400), I change the IAT to 12 hrs for 2 items per day. Utilization for the next 100 days will be 100%. Current statistics and charts show the final average utilization for the 4800 hr run as 75%. I want to be able to capture the 50% for period 1 and the 100% for period 2. I know I can reset stats after period 1, but that will affect other statistics.

Any way to slice the data in this way vs. tracking hours and calculating via code?

FlexSim (other)
FlexSim (other - please specify)
statisticsutilization
· 1
5 |100000

Up to 12 attachments (including images) can be used with a maximum of 23.8 MiB each and 47.7 MiB total.

Jordan Johnson avatar image Jordan Johnson ♦♦ commented ·

@Michael O'Connell Is upgrading to 17.2 a possibility? There are some new statistical features that can do what you need in that version.

0 Likes 0 ·
Jacob Gillespie avatar image
1 Like"
Jacob Gillespie answered

You can do this with your state chart.

Go to the General tab of the chart's property window and check Collect Entire State History for Post-Process Filtering. Press OK.

Run the model to completion and then go back to the General tab and enter 0 to 2400 in the Filter By Time option. Press Apply.

The chart will update based on the filter.

Export to CSV to get the raw filtered data.


collectentire.png (16.0 KiB)
filterbytime.png (2.4 KiB)
chart.png (2.8 KiB)
5 |100000

Up to 12 attachments (including images) can be used with a maximum of 23.8 MiB each and 47.7 MiB total.

Michael Kramer avatar image
0 Likes"
Michael Kramer answered Michael O'Connell commented

@Michael O'Connell, you could make a custom chart using the processor state for the tracked variable, then export that to a .csv (Excel) file (doc1.zip).


doc1.zip (66.6 KiB)
· 1
5 |100000

Up to 12 attachments (including images) can be used with a maximum of 23.8 MiB each and 47.7 MiB total.

Michael O'Connell avatar image Michael O'Connell commented ·

@Michael Kramer, the value that is accessed is still the value since time zero.

Many of the charts allow data to be collected for a certain time interval which led me to believe I could access the data that way. Unfortunately, it appears that the data in the tree for that type of chart still reflects the full run. However, one that represents total output, for example, displays the number correctly (100 for the first 2400 hours, 200 for the next 2400 hrs). One that represents states does not (should be 50% for first 2400 and 100% for next 2400). It shows 75% for both.

I know I can accomplish it by storing/exporting data and doing some calculations, but when the number of states grow to include off shift, down time, etc., that becomes messy.

0 Likes 0 ·

Write an Answer

Hint: Notify or tag a user in this post by typing @username.

Up to 12 attachments (including images) can be used with a maximum of 23.8 MiB each and 47.7 MiB total.