question

Kevin avatar image
0 Likes"
Kevin asked Claire Krupp commented

Track maximum number of entities in system during a simulation run

Hello,

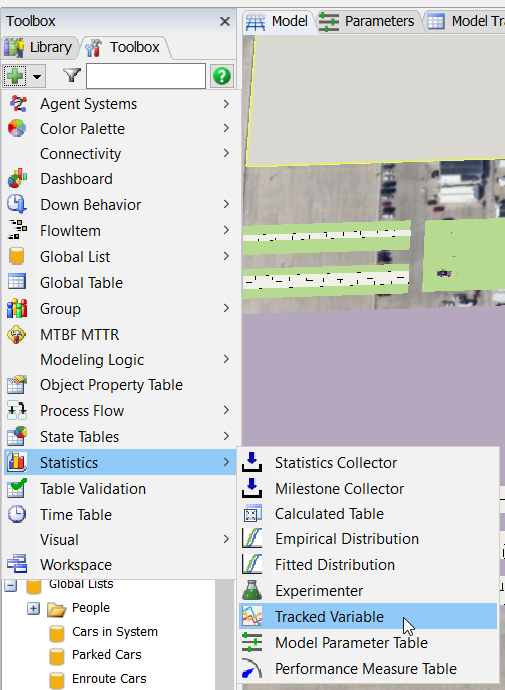
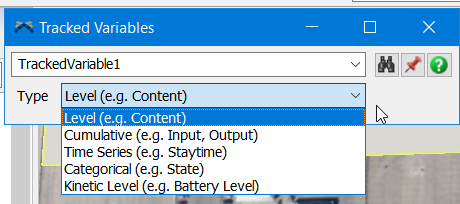
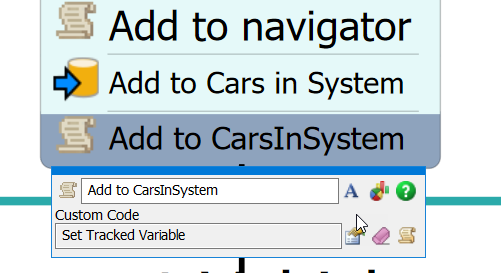
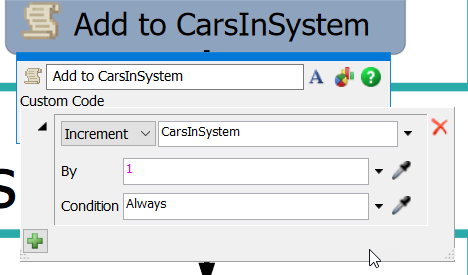
I have a simulation with a queue, followed by a processor, another queue and more processors processing entities in batches of 5 before sending them to the sink. During my simulation run I am able to track the maximum number of entities in the entire system by either using WIP by type on a dashboard with queue as entrance point and sink as exit point, or using the statistics collector to add 1 on queue entry and subtract 1 on sink exit. Both of those solutions seem to work and produce a number of entities in the simulation live during the simulation run. If there is an easier way to track this I'd be happy to hear your suggestions. I can't seem to figure out a way to produce the maximum number of entities in the simulation run into a global table or a similar solution. I would like to use the experimenter to run several replications of my simulation and have the maximum number produced and stored for each replication. Any help and suggestions are appreciated. Thank you!

Kevin

FlexSim 23.2.0
global tablelabelsstatistic collectorglobal variablesmaxcontent
5 |100000

Up to 12 attachments (including images) can be used with a maximum of 23.8 MiB each and 47.7 MiB total.

1 Answer

Claire Krupp avatar image
0 Likes"
Claire Krupp answered Claire Krupp commented

I recommend you use a Tracked Variable. Define it in the ToolBox under "Statistics", and give it a name (mine is called "CarsInSystem":

1743098922376.png

The type you would need is probably "Level (e.g.Content)"

1743099350168.png

Then you can use Process Flow to update it. Create a "Custom Code" activity and look for an option in the drop-down menu for "Set Tracked Variable":

1743099070334.png

Then there is a menu option where you can choose Increment or Decrement:

1743099214774.png

You'll pick one (or more) places to increment and one (or more) to decrement. (You can also do it in a 3D trigger if needed.)

In order to see how the value changes over time (which will also show you the min and max) then choose a Tracked Variable chart from the "General" options:

1743099543166.png

And you will get something like this:

1743099645512.png

You also have the option to view a table with Min, Max and Average values, which are calculated for you automatically.


1743098922376.png (113.8 KiB)
1743099070334.png (30.9 KiB)
1743099214774.png (21.3 KiB)
1743099350168.png (31.6 KiB)
1743099543166.png (12.2 KiB)
1743099645512.png (31.8 KiB)
· 2
5 |100000

Up to 12 attachments (including images) can be used with a maximum of 23.8 MiB each and 47.7 MiB total.