question

jim.draper avatar image
0 Likes"
jim.draper asked Paul Toone edited

Fluid Object stats

When I downloaded Flexsim 2016, the very useful feature of seeing Content, Throughput and State for each object from the Fluid library apparently went away? Where did it go? How can I see these during a live run?

FlexSim 16.2.1
tutorial em portuguesfluid object statistics
5 |100000

Up to 12 attachments (including images) can be used with a maximum of 23.8 MiB each and 47.7 MiB total.

1 Answer

·
Phil BoBo avatar image
1 Like"
Phil BoBo answered Phil BoBo commented

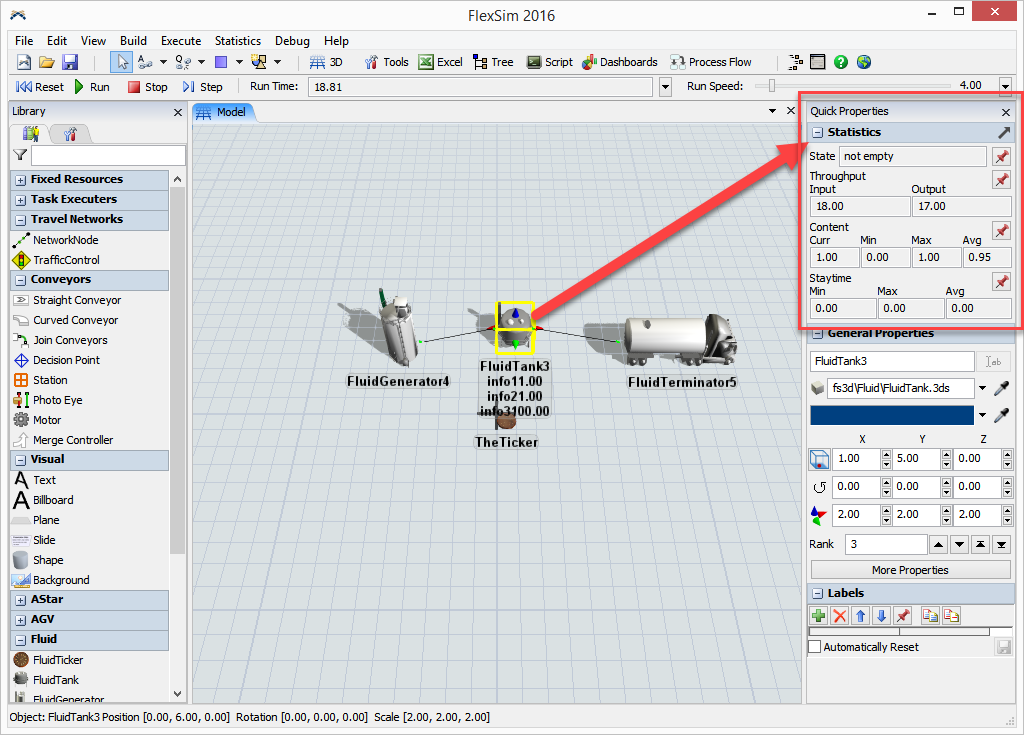
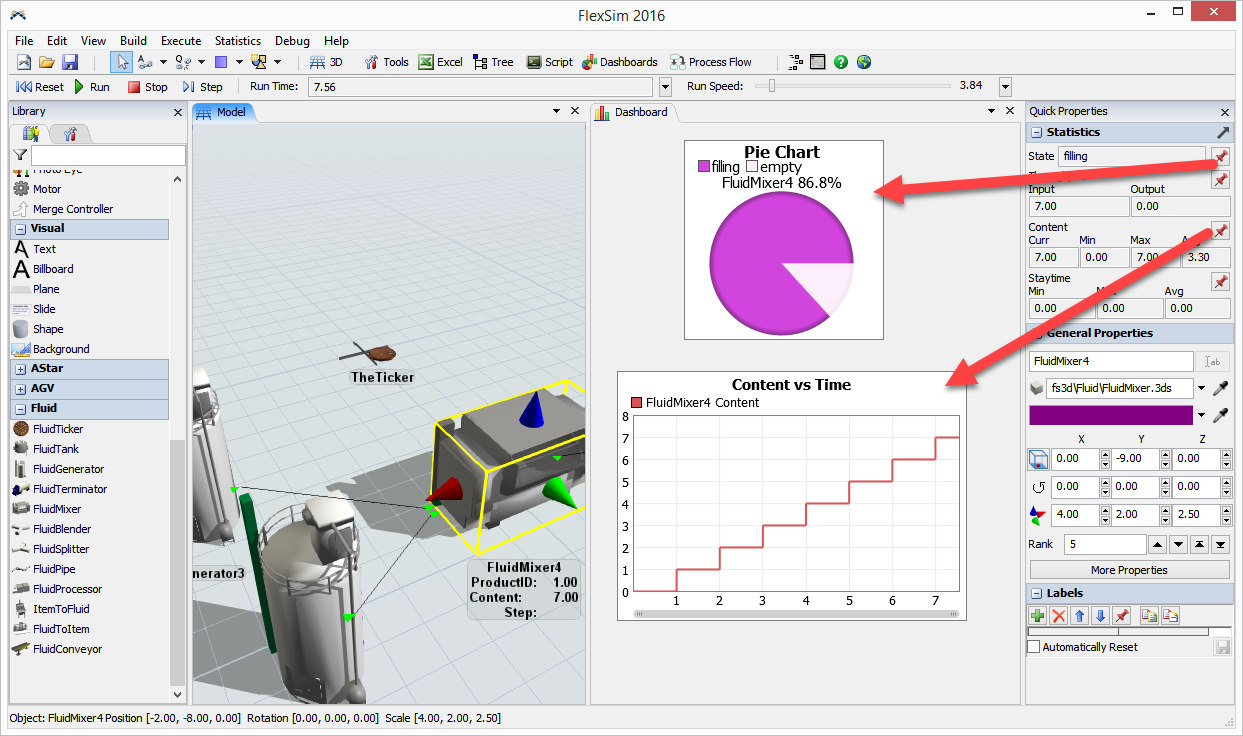
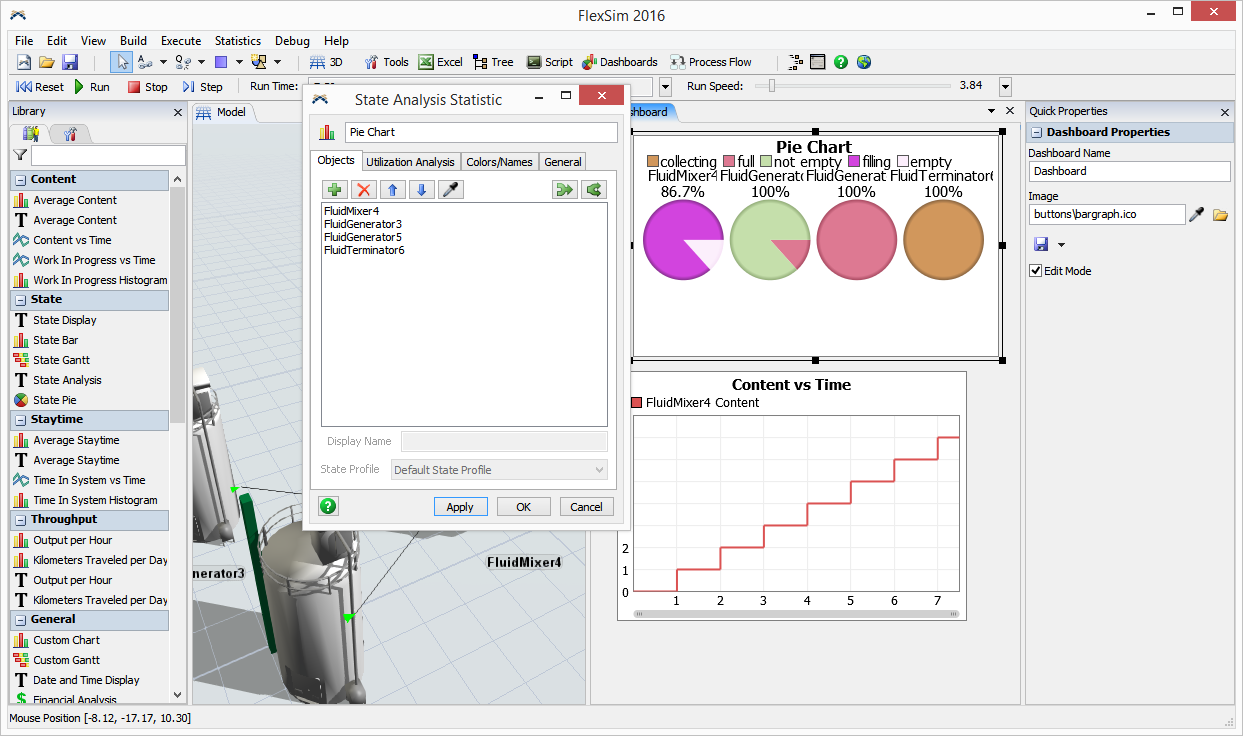
The statistics are on the Quick Properties window now:


· 2
5 |100000

Up to 12 attachments (including images) can be used with a maximum of 23.8 MiB each and 47.7 MiB total.

jim.draper avatar image jim.draper commented ·

Okay thanks. This brings up two more questions. Where are the charts showing the % of time each fluid object is in a certain state? Also, is there a way to view more than one object's stats simultaneously?

Thanks.

0 Likes 0 ·
Phil BoBo avatar image Phil BoBo ♦♦ jim.draper commented ·

If you push the pin buttons, you can pin these stats as charts on a Dashboard:

You can pin multiple objects to different charts, or double-click on a chart to add additional objects onto the same chart:

0 Likes 0 ·

Write an Answer

Hint: Notify or tag a user in this post by typing @username.

Up to 12 attachments (including images) can be used with a maximum of 23.8 MiB each and 47.7 MiB total.