question

Valu R avatar image
0 Likes"
Valu R asked Valu R commented

Differences : average LOS and sample mean LOS

Hi,

Could you please tell me a possible explanation for big differences between average LOS and sample mean LOS calculated by FlexSim ?

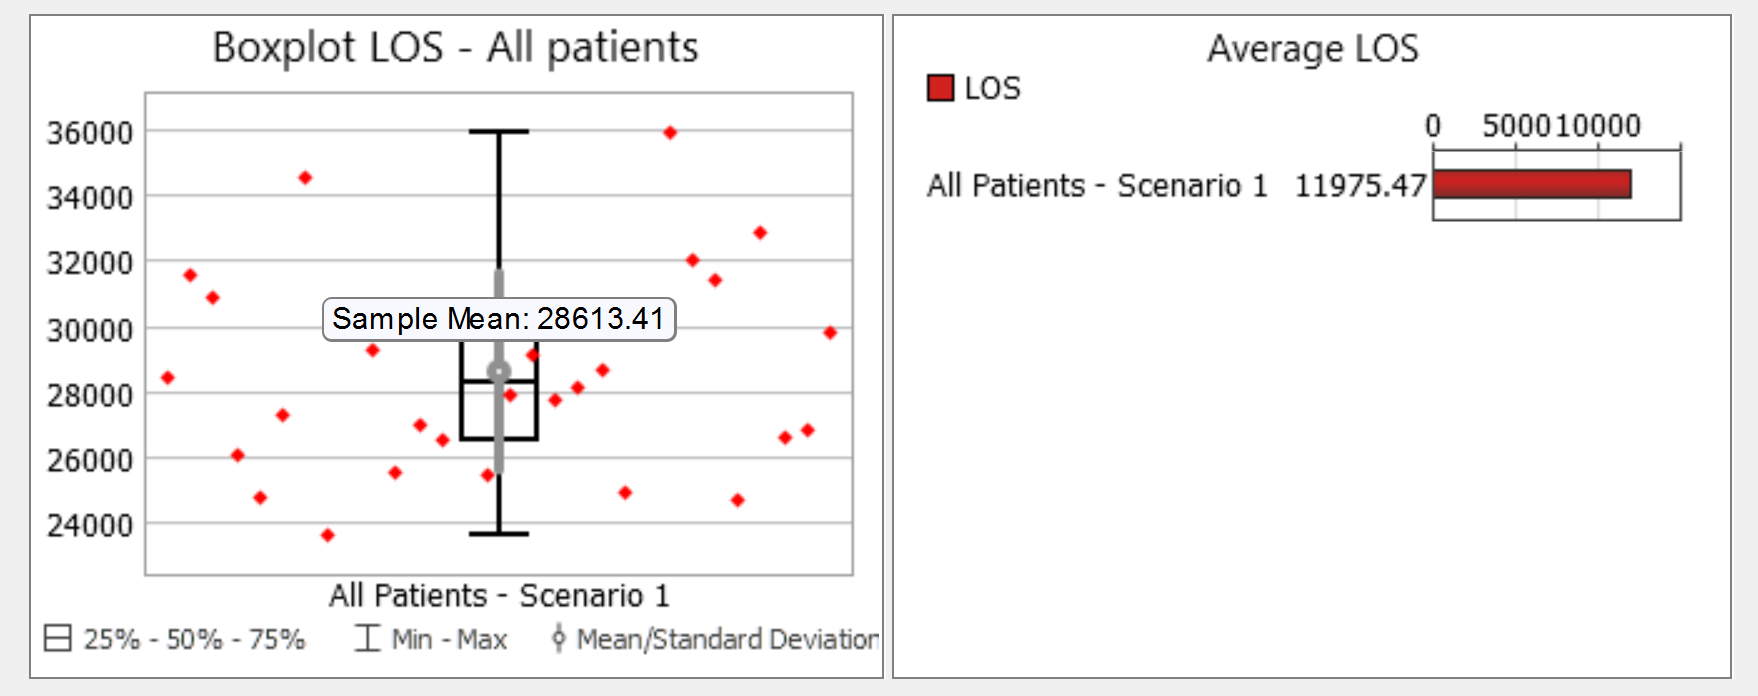
In the attached picture, you can see these differences (for. e.g. here average LOS for all patients is 11'975, but sample mean LOS is 28’613). I have the same issues for specific PCI average LOS/sample mean LOS.


Thanks in advance for your help,

Valentin

los
5 |100000

Up to 12 attachments (including images) can be used with a maximum of 23.8 MiB each and 47.7 MiB total.

1 Answer

·
Matthew Gillespie avatar image
2 Likes"
Matthew Gillespie answered Valu R commented

The short answer is that the Sample Mean on the Dot plot is an average of averages, whereas the Bar chart is just the average.

In this picture I show the result of a simple experiment run I did. I ran a single replication of two different scenarios. The first scenario only has one patient arrive and the second scenario has two patients arrive.

The sample mean on the Dot plot is calculated as the average of the average LOS of replication 1 and the average LOS of replication 2:

Sample mean = (Avg LOS Rep 1 + Avg LOS Rep 2) / 2
53.169 = (56.748 + 49.590) / 2

The Average Length of Stay is calculated as the average of each individual LOS:

AVG LOS = (LOS1 + LOS2 + LOS3) / 3
51.976 = (56.748 + 49.59 + 49.59) / 3

los.png (20.0 KiB)
· 1
5 |100000

Up to 12 attachments (including images) can be used with a maximum of 23.8 MiB each and 47.7 MiB total.

Valu R avatar image Valu R commented ·

Great, thanks a lot for these precious information !

0 Likes 0 ·

Write an Answer

Hint: Notify or tag a user in this post by typing @username.

Up to 12 attachments (including images) can be used with a maximum of 23.8 MiB each and 47.7 MiB total.