question

Steven Chen avatar image
0 Likes"
Steven Chen asked Steven Chen commented

Custom Item Trace Gantt

Hello,

The default item trace gantt will create rows for every item. I want to make the entries of item that are same type into one row, is there a way to achieve that?

Another question, how to trace the items that placed on pallet? Items will go somewhere with pallet, sometime leave pallet and go to another queue or processor. How to trace this and display rows for every item?

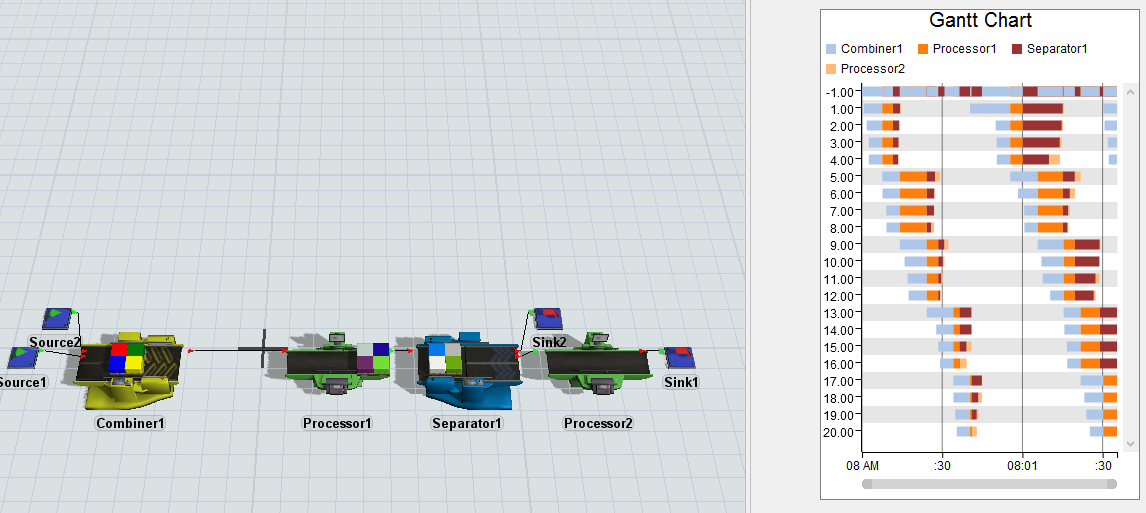
FlexSim 17.1.4
gantt chart
5 |100000

Up to 12 attachments (including images) can be used with a maximum of 23.8 MiB each and 47.7 MiB total.

1 Answer

Jordan Johnson avatar image
0 Likes"
Jordan Johnson answered Steven Chen commented

@steven.chen

I made a model (in 17.2) that demonstrates this capability using the statistics collector (itemtraceganttrowbytype.fsm).

If you haven't used the statistics collector before, it may be helpful to go through the tutorials in the help manual for that tool. Here's how the example model works.

First, I made a group of all the objects that I want to trace the items through. If you want to exclude an object, just remove it from the group. In the sample model, this is all fixed resources except sources and sinks.

Then I made sure that all items have a type. I even added a type to the pallets to make it easy to tell them apart from regular objects.

Next, I added a statistics collector. On the event listening tab, I listened to two events: the OnEntry of the group, as well as the OnExit. In both cases, I renamed the Entering/Exiting item label to just Item. Once I added those two events, I added two shared labels. The first is called Items, and it is an array of all sub items, with the item appended. I wrote the code, but it was fairly straightforward. The second is called RowValues. This is where things get interesting; I'll explain what I did for this one here, and explain why I did it later. The RowValues array is the same length as the Items array, and it contains a string of statistics collector IDs, plus the type of the item, appended together with underscores between. This string has two purposes: to be unique for each combination of item/object, and to hold the type information.

At this point, whenever OnEntry or OnExit fires, the Statistics Collector will create labels on the data object for all the Items, and all the RowValues.

Now we can look at the Data Recording tab. For the row mode, I picked Unique Row Values, and chose the RowValues array as the value. This means that, for each value in the RowValues array, the Statistics Collector will look up the row for that value. If the row isn't there, the collector will make a new row.

For columns, we need 4. This is because the Gantt chart expects four columns: A row value, a start time, an end time, and a color value. Each unique row value gets its own row on the chart, and each unique color value gets its own color the chart.

The first column is the type value. I used the string.split() method to get the third appended number (the type value) out of the row value. The second and third columns are both Model.dateTime columns. The fourth column is the object id, which I get from data.eventNode.

This whole process makes more sense if you start with what data the Gantt chart expects. The Gantt chart expects a table with four columns (row value, start, end, and color value). Every row creates a colored box on the Gantt chart. In our case, we want every row to correspond to the Type of the item. For start and exit times, we want the time when an item enters and exits every object. For color, we want each object.

So we used the features of the Statistics Collector to create a table that matched the Gantt criteria. We also made sure the table correctly handles pallets, along with single items. Hopefully, this helps you on your way.


· 2
5 |100000

Up to 12 attachments (including images) can be used with a maximum of 23.8 MiB each and 47.7 MiB total.

Jordan Johnson avatar image Jordan Johnson ♦♦ commented ·

There are features planned for 18.0 that will make this process somewhat more intuitive, specifically for making and using the row value.

0 Likes 0 ·
Steven Chen avatar image Steven Chen Jordan Johnson ♦♦ commented ·

Not tried statistics collector before. It seems much easy to understand and create my custom chart. Nice work!

0 Likes 0 ·