question

Roi Sánchez avatar image
1 Like"
Roi Sánchez asked Roi Sánchez commented

Change axes in bar chart

Hello all,


Is there a way to change the values in axes in a bar chart? What I mean is to change the values in X to Y and the values in Y to X.

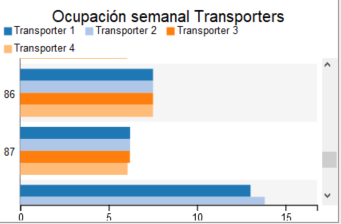
In the attached picture, you could see I have occupation rates displayed in X and time data in Y and I would like to display time data in X and occupation rates in Y. This bar chart is updated dinamically (each week) from values in a calculated table.

FlexSim 18.1.0
statsbar chart
· 1
5 |100000

Up to 12 attachments (including images) can be used with a maximum of 23.8 MiB each and 47.7 MiB total.

Roi Sánchez avatar image Roi Sánchez commented ·

Attached picture.

0 Likes 0 ·
captura.png (15.6 KiB)

1 Answer

·
Sam Stubbs avatar image
0 Likes"
Sam Stubbs answered Roi Sánchez commented

Sorry, from what I understand, Vertical bar charts are not currently supported in the new Stats Collector charts at this time.

· 1
5 |100000

Up to 12 attachments (including images) can be used with a maximum of 23.8 MiB each and 47.7 MiB total.

Roi Sánchez avatar image Roi Sánchez commented ·

OK. Thank you @Sam Stubbs.

0 Likes 0 ·

Write an Answer

Hint: Notify or tag a user in this post by typing @username.

Up to 12 attachments (including images) can be used with a maximum of 23.8 MiB each and 47.7 MiB total.