question

Mason W avatar image
0 Likes"
Mason W asked Emily Hardy answered

Collect Statistics by Time

Hi all,

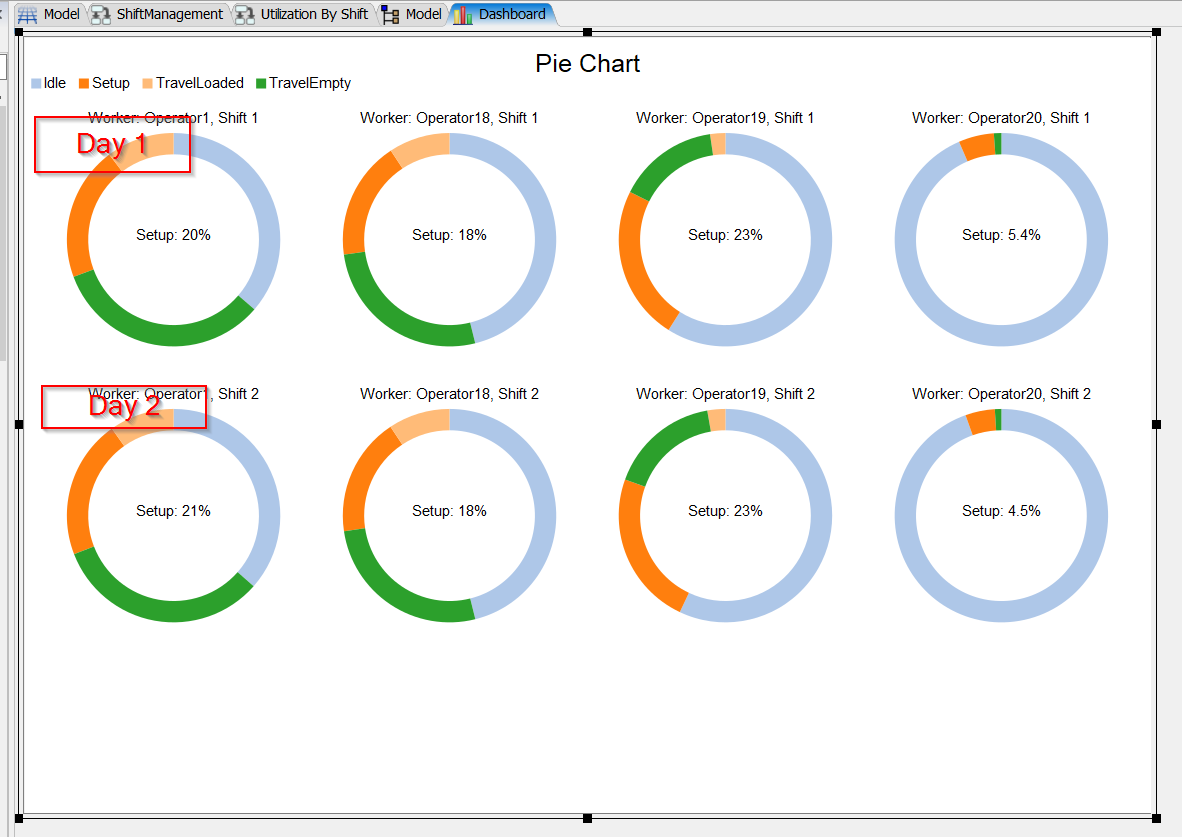
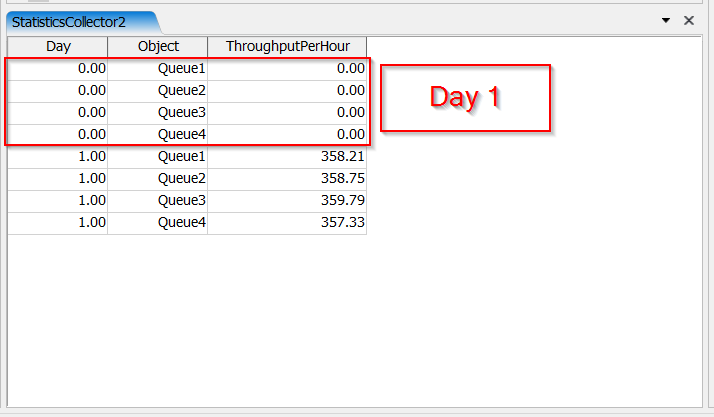
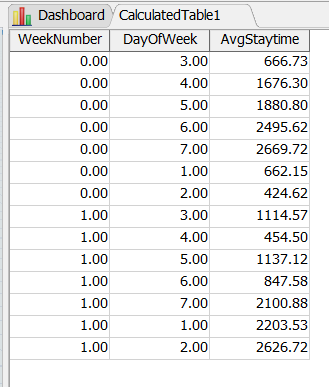
What's the best way to collect statistics by a given time? For example, I want to run a simulation for a week, but would like to collect statistics separately by day due to varying volume levels. So basically a similar dashboard, but one for each day of the week. I'm not sure the best route to take with something like this.

Thanks in advance,

FlexSim 18.0.3
statistics
· 4
5 |100000

Up to 12 attachments (including images) can be used with a maximum of 23.8 MiB each and 47.7 MiB total.

Mason W avatar image Mason W commented ·

@Isaac L I do not have that much experience with Statistics Collector

0 Likes 0 ·
Isaac Litster avatar image Isaac Litster Mason W commented ·

If you haven't already, I would recommend going through the Statistics Collector Tutorial in the User Manual. It is located under Tutorials, Additional Tools Tutorials, Tutorial 3 - The Statistics Collector. I will also have someone send you an example model.

0 Likes 0 ·
Emily Hardy avatar image Emily Hardy ♦ commented ·

Hi Mason, this depends on what kind of statistic you are trying to track (staytime, average content, etc) and how you want to track things over time: do you want to see the stats for every Monday (for example) combined, or do you want every week separate from past weeks? Does that make sense? If you can give me some more information I can create a sample model for that shows how we can do this.

0 Likes 0 ·
Mason W avatar image Mason W commented ·

@Emily Hardy appreciate the help! I would say the main metrics would be operator utilization, throughput per hour, and average staytime. Preferably looking at this for each day of the week as I mentioned, but consolidating the single days across weeks would be fine.

Hope that makes sense. Thanks again!

0 Likes 0 ·

1 Answer

·
Emily Hardy avatar image
1 Like"
Emily Hardy answered

Mason,

This is not a default option for FlexSim but these statistics can be built using existing options in the statistics collector. I do recommend going through the tutorials for the Stats Collector, as that should make the following models more clear and understandable.

Operator Utilization: This model is based off of this article. This creates a state pie chart based on the operator utilization each day. A new row of pie charts will be created every day, so you'll want to turn up the speed of the model to see those new charts being added daily.

dailyutilization.fsm

Throughput per hour per day: This model creates a chart that gives the average throughput per hour, per day, per queue. For this one, use process flow to create the labels "OldOutput" and "TPH" (throughput per hour), then wait 1 day, and then we access those labels again. Now, we find the current output and the daily output (which is the current output - old output). These are the labels that appear in the table in the dashboard StatisticsCollector2.

throughputperhourperday.fsm

Average Staytime: To find the average staytime per day, we will use a calculated table. This table gives the week number (0, 1, 2, etc) and the day of week (Sunday is 0, Monday is 1, etc), and the average staytime on that day of that week.

avgstaytime.fsm

Hopefully these 3 models will answer your question and give you a basis for creating your own custom statistics and tables.


5 |100000

Up to 12 attachments (including images) can be used with a maximum of 23.8 MiB each and 47.7 MiB total.

Write an Answer

Hint: Notify or tag a user in this post by typing @username.

Up to 12 attachments (including images) can be used with a maximum of 23.8 MiB each and 47.7 MiB total.