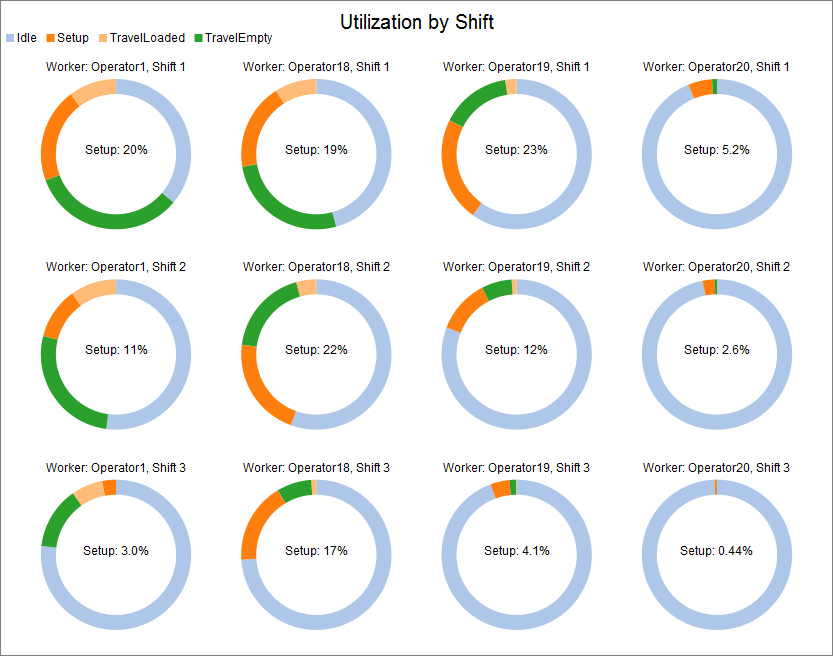
Many simulation models need to show operator or machine utilization by time period of day, or per shift:
Under Construction Summary
Until this article is completed, here is the basic idea. I use a process flow to create one token per operator in the group. Each operator token creates one token per shift. The shift token creates its own Categorical Tracked Variable (which is how state information is stored on all objects). The shift token just remains alive, holding the tracked variable.
The oeprator token goes into a loop, listening to OnChange of the 3D Operator's state profile node. Whenever the state changes, the token sets the shift token's state label to the same state. This essentially copies the state changes onto another tracked variable. Another child token listens for when the shift changes. When the shift changes, the operator token puts the current shift profile into some unused state (STATE_SCHEDULED_DOWN, in this case), and then applies new state changes to the correct shift token's label.
A Statistics Collector listens for when the Operator token starts the main loop at the beginning of each shift. When this happens, the collector saves a row value that is an array, composed of the operator and the shift token. The row mode is set to unique, so that each unique combo of operator/profile gets its own row.
Each column in the collector is made to show the data from the shift corresponding to that row. The result is the table shown in the article, which can be plotted with a pie chart as shown above.
