This article reviews how to use the Zone, along with the Statistics Collector, to create a bar chart of the current work-in-progress (WIP) by item type. The method scales to as many types as you need (this example uses 30 types), and can easily adapted to text data, like SKU. An example model ( zonecontentdemo.fsm) demonstrates this method.
Creating the Process Flow
To create this chart, we first need to gather the data for this chart. In this case, it is easiest to build off the capabilities of the Zone. In particular, we will use Zone Partitions to categorize all of our object. After we set up the Zone, we'll use a Statistics Collector to gather the data that we need.
Create a new General Process Flow. You can have as many General Process Flow objects as you want, so let's one that just deals with gathering statistics. This way, gathering statistics will not interfere with the logic in our model. The process flow should look something like this:
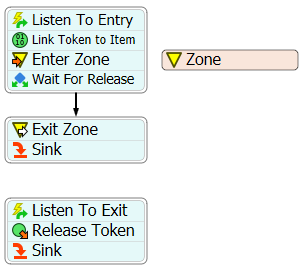
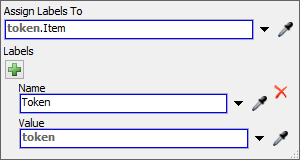
Here's how it works. The Listen to Entry is configured to listen to a group of objects. In this case, the group contains all the sources in the model, and it's listening to the OnExit of the sources. However, it could be OnEntry or OnExit of any group of 3D objects. If you want to split the statistics by Type or SKU, then any flowitem that reaches the entry group already has the appropriate labels. In this example model, when a flowitem leaves any source, a token gets created. The token makes a label called Item that stores a reference to the created item, as shown in the following picture.

The next step is to link the flowitem with the token that represents it. The Link Token to Item is configured like this:
Now, the Item has a label that links back to the token. The token then enters a zone. The Zone is partitioned by type:
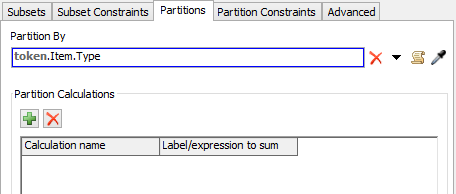
At last, the token comes to a decide activity. The decide is configured not to release the token. The token will be released by the second part of the flow. Once the token is released, it exits the zone, and goes to a sink.
The second part of the flow also has an event-triggered source, that is configured to listen to all the sinks in the model. Again, the entry objects and exit objects are arbitrary; you can gather data for the entire model, or for just a small section of the model, using this method. The event triggered source also caches off the item in a label.
At this point, we need to release the token that was created when items entered the system. To do this, the Release Token activity is configured as seen here:
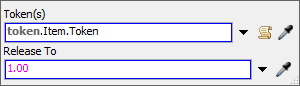
The token created on the exit side has a reference to the item, which has a reference back to the token created on the entry side. We release this token to 1, which means connector 1.
Note: We could have used a wait for event activity in the zone, and then used the match label option to wait for the correct item to leave the system. However, this method is much, much faster, especially as the number of tokens grows.
Creating the Bar Chart Statistics Collector
The next step is to create a statistics collector that gathers data appropriate for a bar chart. Note that this method will grow the number of rows dynamically, so that it won't matter how many types (or SKUs) your model has; you will still get one bar per type/SKU. In order to make the number of rows dynamic, we need to listen to the OnEntry and the OnExit of the zone activity:
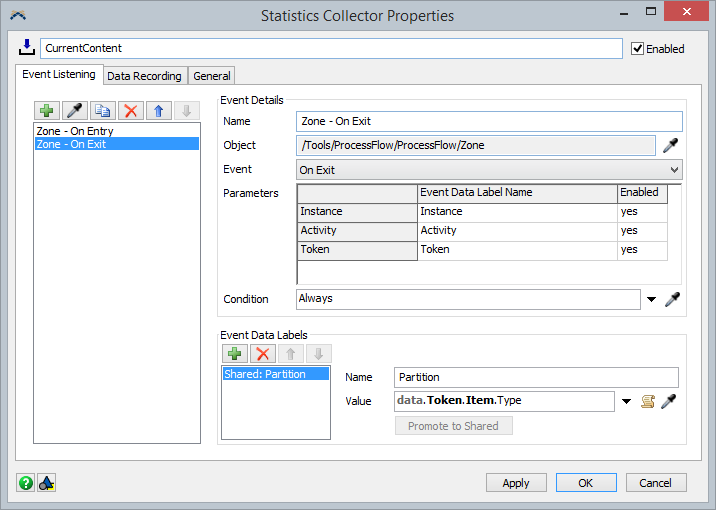
Notice the shared label on this collector. Because this label is shared, both the OnEntry and OnExit events will create this label on the data object. The value of this label is the item's type.
Next, we move to the Data Recording tab. Set the Row Mode to Unique Row Values, and set the row value to Partition.

This means that whenever an event fires, the statistics collector will look at the partition label on the data object. If the value is new to the statistics collector, the collector will make a new row for this value. If not, then the collector will use the row that is already present.
Finally, we need to make our columns. We only need two columns: one for the Partition, and one for the Content of that partition. Both of these columns can use the Integer storage type, and raw display format. However, if your partition value was text-based, like an SKU, you should use the String storage type. The value for Partition is just the data object's Partition label:

Notice that the Update option is set to When Row is Added. This way, the statistics collector knows that this value will not change, and that it's available at the time the row is created.
The other column is a little harder, because we need to use the getstat command:
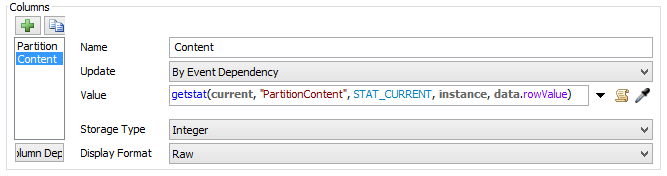
The getstat command arguments depend on the stat you are trying to get. In this case, we are asking the zone (current, the event node) for the Partition Content statistic. We want the current value. Since this is a process flow activity, we pass in the instance as the next argument. Finally, we pass in which partition we want to get the data from, the row value. In this case, we could have identically passed in data.Partition.
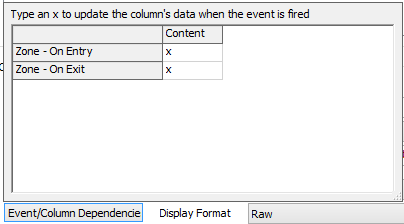
Also, notice that this column is updated by event dependency. To make sure this does what we want, we need to edit the event/column dependency table. We want the Content column to be updated when items enter and exit, so it should look like this:
Now, open the table for the statistics collector. You should see two columns. When you run the model, rows will be added as items of different types are encountered. The table will look something like this:

This screenshot came from early in the model, before all 30 types of item has been encountered, so it doesn't have 30 rows yet.
Making the Bar Chart
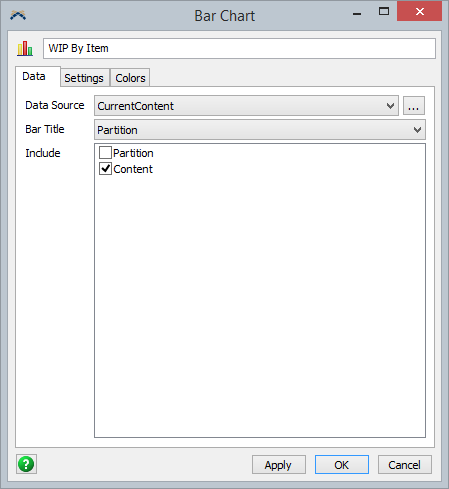
This is the easiest part. Create a new dashboard, and add a new bar chart. Point the chart at the statistics collector. For the Bar Title option, choose the Partition column. Be sure to include the Content column. Also, make sure that the "Show Percentages" checkbox on the Settings tab is cleared. The settings should look like this:
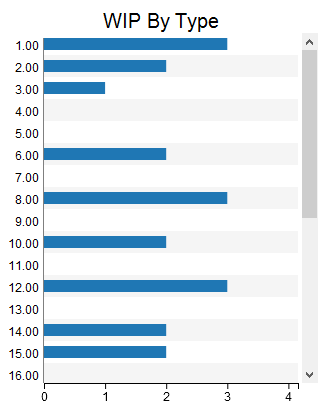
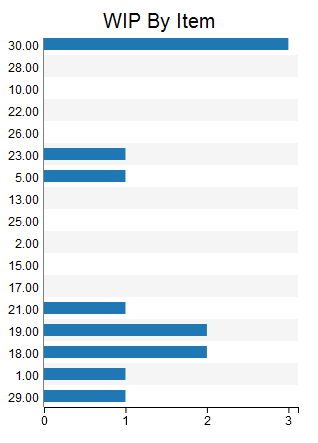
The resulting chart looks something like the following image. You can set the color on the Colors tab.
Ordering the Data
Because the rows of this table are created dynamically, the order of the rows will likely change run to run. To force an ordering, you can use a calculated table. Since the number of rows on this table don't grow indefinitely, and the number is relatively small, it's okay to set the Update Mode on the calculated Table to always. Here's what the properties of that calculated table look like:
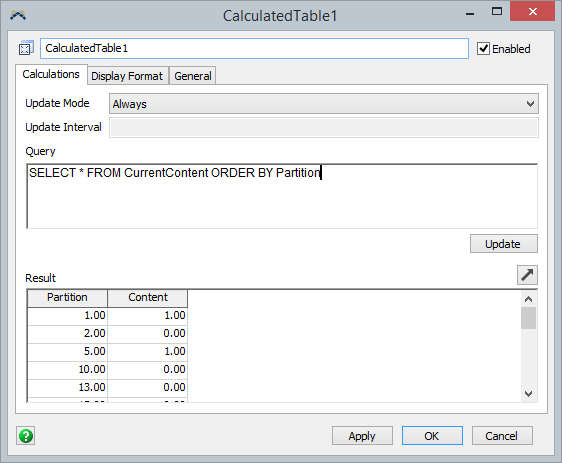
We simply select all columns from the target collector (CurrentContent, in this case) and order it by the Partition column. That yields an ordered bar chart:
Example and Additional Charts
The attached example model demonstrates this method, as well as how to create a WIP By Type vs Time chart:
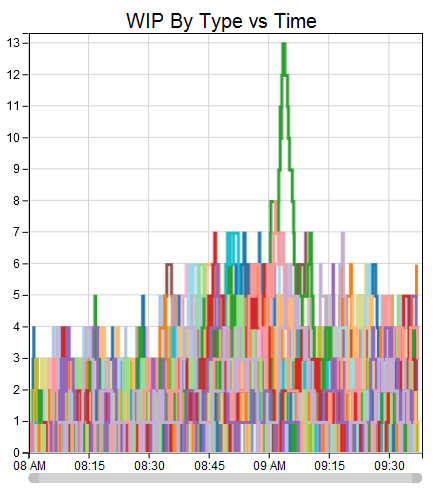
Happy data collecting! zonecontentdemo.fsm
