This article reviews one method for making a state Gantt chart for the default and alternate state profiles:

Example Model
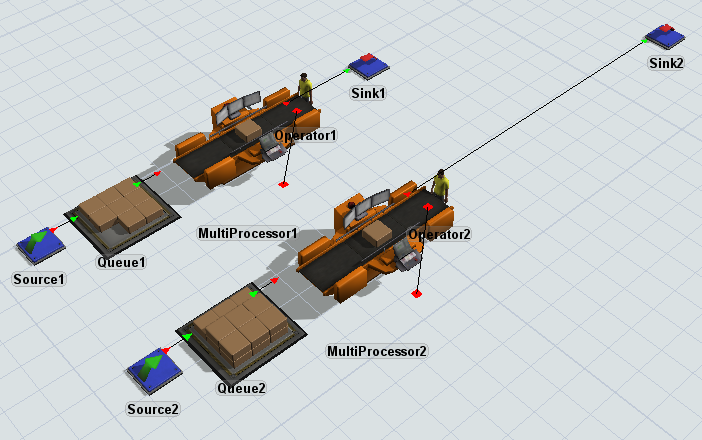
You can download the model for this walkthrough ( stateganttdemo.fsm). The model has two multiprocessors, in a Group called Multiprocessors. Each multiprocessor has two processes: Process1 and Process2.
To make the chart, we will first make a Statistics Collector, and then a Calculated Table.
Making the Statistics Collector
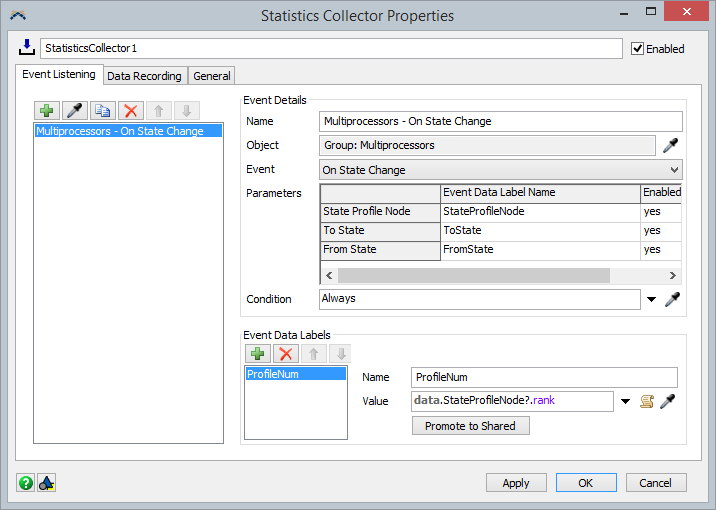
Make a new Statistics Collector. On the Event Listening tab, use the Sampler to listen to On State Change of the group of multiprocessors. You can leave the parameter names alone. However, we need to add a label, so we can record the profile number. Select the new event, and then use the green plus button in the Event Labels area to add a label for this event. Set its name to ProfileNum, and its value to the following code:
- data.StateProfileNode?.rank
The event settings should look something like the following:
Next we need to set the row mode. Make sure it's set to Add Per Event, with no row value.
As the final configuration step for the statistics collector, we need to set up the columns. There should be four columns in this collector:
- Time - In the pick options, select Time, then Model Date/Time
- Object - In the pick options, select IDs, then ID of Event Object
- Profile - Type data.ProfileNum for the value. The default storage and display format are fine.
- State
- Type the following code:
data.eventNode.as(Object).stats.state(data.ProfileNum).profile[data.ToState + 1][1] - Set the Storage Type to String
- Type the following code:
The code is necessary because On State Change occurs before the state is set to the new state. So the code is looking up the name of the future state in the profile table. When you reset and run this model, you will see a table like the following:

Making the Calculated Table
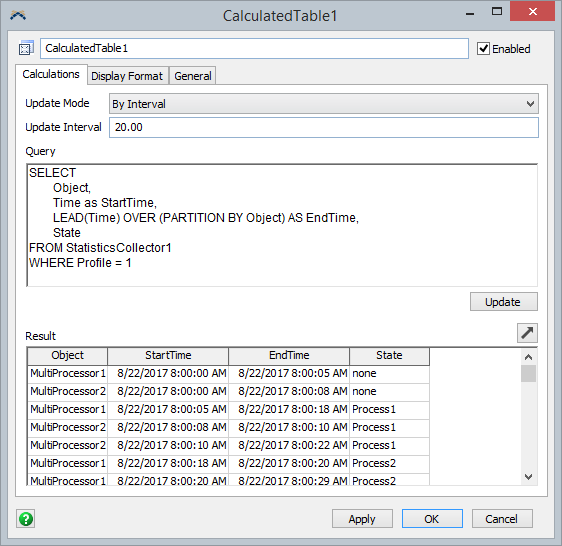
Make a new Calculated Table, and give it the following query:
- SELECT
- Object,
- Time as StartTime,
- LEAD(Time) OVER (PARTITION BY Object) AS EndTime,
- State
- FROM StatisticsCollector1
- WHERE Profile = 1
This query creates an Object column as well as a Time column. To get the time that the current state ends, we look to when the next state begins. The LEAD() function looks ahead in the table, and the OVER(PARTITION BY Object) clause makes sure that LEAD() makes sure to look to the next row with the same Object. We also record the state column, and filter out the standard state profile, keeping the special multiprocessor state profile.
Once you get this query to work, change the Update Mode to By Interval, and set the interval to 20 or 30. Since the Statistics Collector table will get longer and longer, the query will become more and more expensive as the model runs. To control how much time is spent running the query, we use an interval. The final configuration of the Calculated Table should look like this:
You will need to set the Display Format of each column on the Display Format tab (Object, Date/Time, Date/Time, and Raw).
Making the Chart
Make a new dashboard, and create a Gantt chart. Point it at the Calculated Table. When you do that, the chart should fill in all the other columns correctly.
Charting Both State Profiles for Both Objects

In order to chart both profiles on the same chart, we first need to add a column to the Statistics Collector, and then update the query in the Calculated Table.
The new column should be named ObjectAndProfile, and a Storage Type of String. Use the following code for a value:
- data.eventNode.name + " - " + string.fromNum(data.ProfileNum.as(int))
Then change your query to the following:
- SELECT
- ObjectAndProfile,
- Time as StartTime,
- LEAD(Time) OVER (PARTITION BY ObjectAndProfile) AS EndTime,
- State
- FROM StatisticsCollector1
With these changes, you should be able to view both profiles for both multiprocessors.
