In version 2018 and on, you can make this chart by dragging the Throughput Per Hour by Type template from the dashboard library. If you install the template (available on the Advanced tab), you will see a Process Flow and a Statistics Collector appear in your toolbox.
One of the most common questions from FlexSim users is as follows: How do I make a chart that shows the output every hour?
You can make this chart in three steps.
Configure the Statistics Collector
First, you need a Statistics Collector. Make a new one in the toolbox (click the green plus button, select Statistics, and then select Statistics Collector). On the event listening tab, use the green plus button to add a timer event, and configure as shown here:
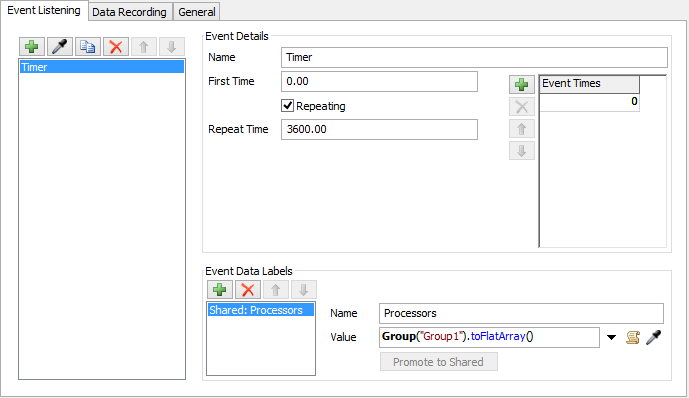
This timer event will fire every hour (every 3600 seconds) in the model. Notice the shared label, that is storing all members of the Processors group as an array. We will use this label in the next step.
Once you have configured the timer, then you need to set up the row mode for this collector. We want one row per processor, and we need to use the Processors label as the row value. Since the Processors label is an array, we will get three rows per timer event, each row corresponding to a processor.

Finally, we can add the columns. The three columns are as follows:
- Time - use the pick list to select Model Date/Time from the Time menu
- Object - use the pick list to select ID of row value from the IDs menu
- Output - use the pick list to select Statistic by Object from the Object Statistics menu
- Use data.rowValue as the object value in the popup
If you use the pick options to choose these options, then the storage type and display format options should be set automatically.
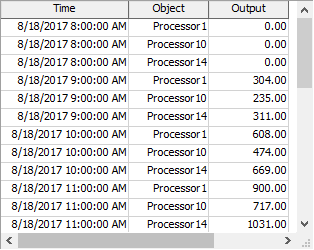
With these three columns in place, we can watch the table populate. Reset and run the model at high speed. Every model hour, you should see a new set of rows appear, one for each processor in the group. The table will look something like this:
Configure the Calculated Table
The Statistics Collector table from the previous steps is close to what we want, except that the output value always increases as the model runs. But what about the output for just a single hour? To get that value, we can use a Calculated Table.
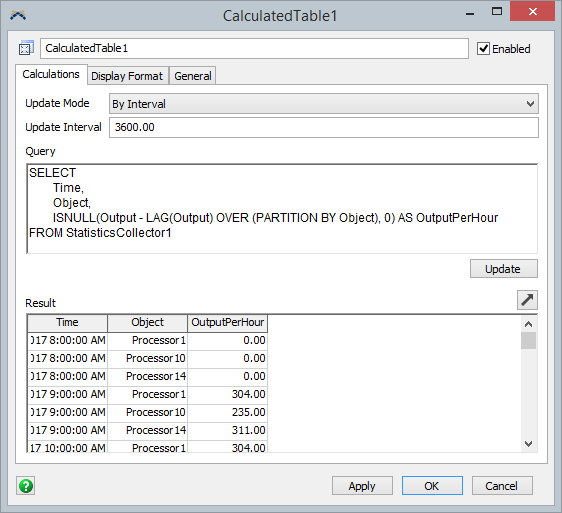
Make a new calculated table, and give it the following query (in the Query field):
SELECT
	Time,
	Object,
	ISNULL(Output - LAG(Output) OVER (PARTITION BY Object), 0) AS OutputPerHour
FROM StatisticsCollector1
This query uses SQL window functions. Basically, it says that each row's value should subtract the previous row's value for the object. In addition, if that value is NULL (because it's the first row), then just use a value.
If you reset and run the model, so that the collector table has at least a few rows in it, click the Update button to run the query. Notice that the Time and Object columns show numbers. This is because the Calculated Table can't infer the formatting of the column. To set the formatting, use the Display Format Tab. You may also wish the table to update every hour, with the Statistics Collector.

Make the Chart
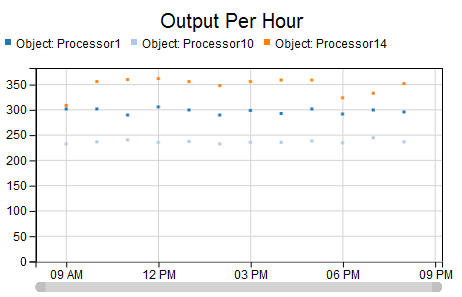
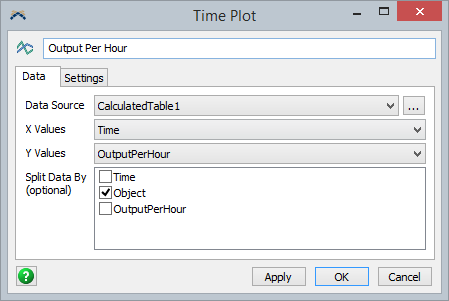
Now that our data is correct, we can make a chart. Make a new dashboard, and create a Time Plot chart. Point the chart to the calculated table. Let's use the Time column for the X values, and let's use the OutputPerHour column for the Y values. In addition, make sure to split by the Object column.
If the calculated table updates every hour, then running the model should create the chart shown at the beginning of the model. Here is the model used to create this chart (should work in 2017 Update 2 Beta or later; beta must be built on or after August 21, 2017). outputperhourdemo.fsm