Hi everyone,
recently @Arun Kr posted this idea to add a utilization vs. time chart to the available chart types in FlexSim. I had previously build a relatively easy to set up Statistics Collector for use in our models. I have since cleaned up the design a bit and thought to post it here, since this seems to be a commonly desired feature.
utilization_vs_time_collector_24_0_fm.fsm
All necessary setup is done through labels of the collector. The first three are actually identical to labels found on the default Statistics Collector behind a state bar chart.
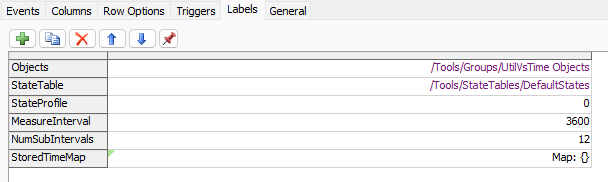
- Objects should point at a group that contains all objects the collector should track the utilization for.
- StateTable is a reference to the state table that will be used to determine which state counts as 'utilized'.
- StateProfile is the rank of the state profile that should be read on the linked objects (0 for default state profile).
- MeasureInterval is the time frame (in model units) over which the collector will take the average of the utilization.
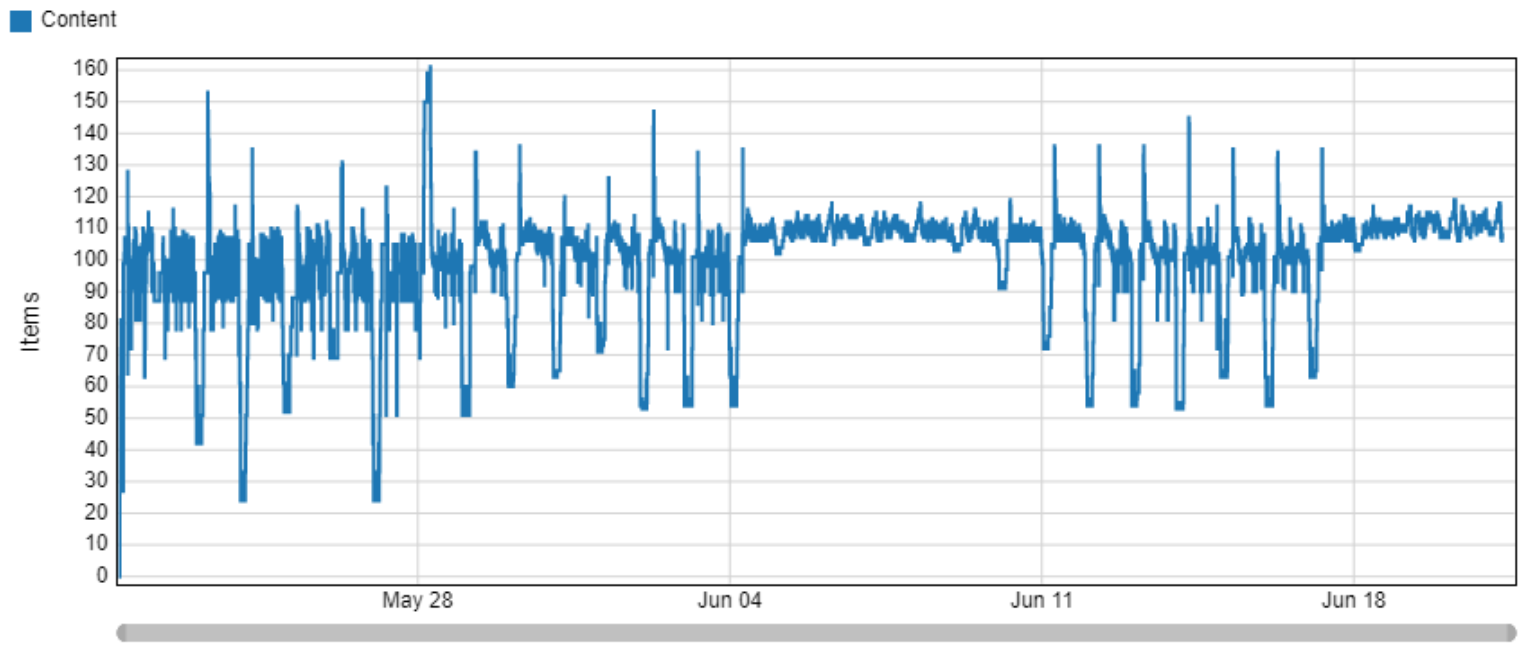
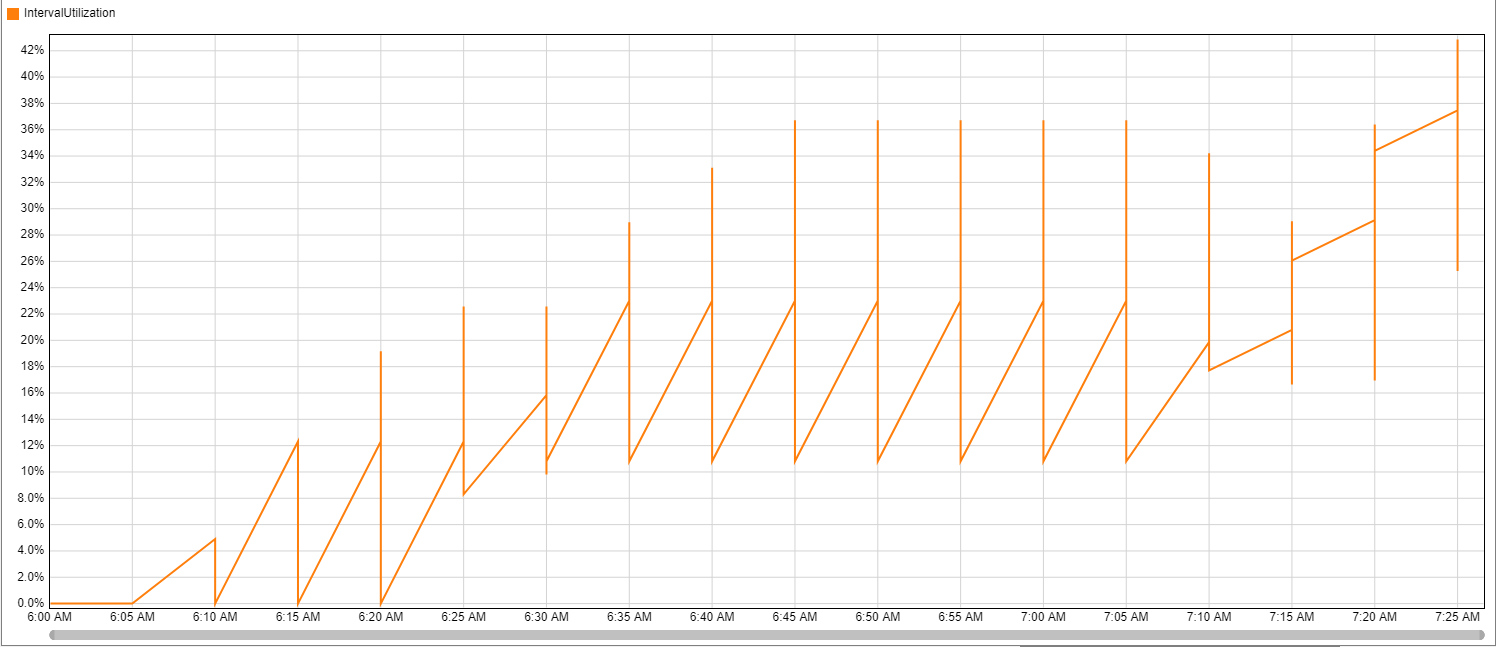
- NumSubIntervals determines how often that measurement is actually taken. In the example image above (and the attached model) the collector measures the average utilization over the last 3600s 12 times within that interval of every 300s. Each meausurement still denotes the utilization over the complete "MeasureInterval".
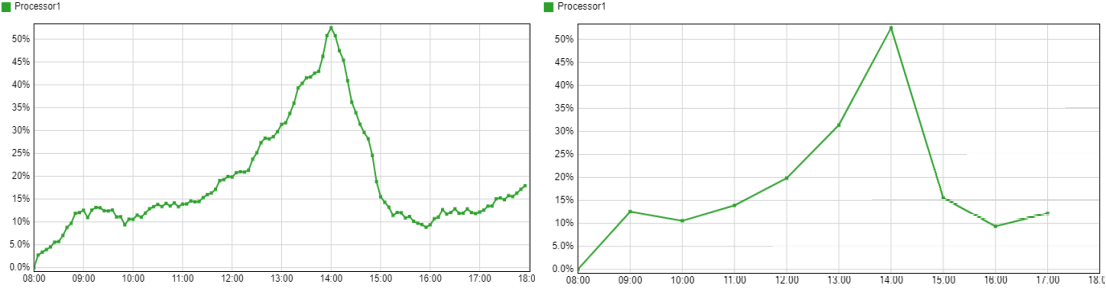
The graph on the left takes a measurement every 5 minutes, the one on the right every 60 minutes. Each point on both graphs represents the average utilization over the previous hour from that time point in time.
- StoredTimeMap is used to allow the collector to correctly function past a warmup time, by storing the total utilized value of each object up to that point. This should no be manually changed. Since this last label has to be automatically reset, remember to save any changes made to the other labels by hitting "Apply".
The collector works by keeping an array of 'total utilized time' value for each object as row labels. Whenever a measurement is taken, the current value is added to the array and the oldest one is discarded. The difference between the newest and oldest value is used to calculate the average utilization over the measurement interval. The "NumSubIntervals" label essentially just controls how many entries are kept in that array.
To copy the collector into another model you can create a fresh collector in the target model. Then copy the node of this collector from the tree of the attached model and paste it over the node of the fresh collector.
I hope this can help to speed up the modeling process for some people (at least until a chart like this is hopefully implemented in FlexSim) or serve as inspiration for how one can use the Statistics Collector.
I might update the post with a user library version if I get to creating it (and if there is demand for it).
Best regards
Felix
Edit: Added user library with the collector as a dragable icon to the attached files.
Edit2: I noticed a bug while using the collector. Having the tracked objects enter states that are marked as "excluded" in the state table would lead to incorrect utilization values (possibly even below 0 or above 100%). Replaced the library with an updated version that fixes this.
Edit3: I fixed another bug that resulted in a wrong utilization value for the first measurement after the warmup time if the object spent time in an excluded state prior to the warmup.