Idea

Arun Kr avatar image
17 Likes"
Arun Kr suggested Jordan Johnson commented

Utilization Vs Time Graph in Dashboard Library

Hi FlexSimmers,

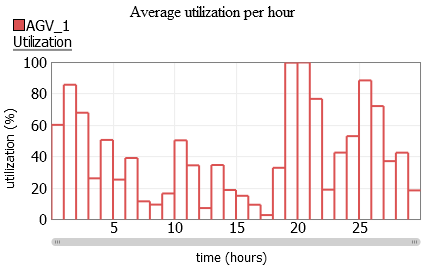
This is a common performance measure requirement which is asked by many customers of us. Constructing the utilization vs time is not an easy task also. The user has to create the utilization vs time from the conceptual model which we provide. I believe that this graph will be a useful addition to the dashboard library in the state section.


1706079701059.png

https://answers.flexsim.com/questions/111045/how-to-graph-utilization-vs-time-in-dashboard.html

Regards,

Arun KR

utilization vs time
1706079701059.png (26.1 KiB)
5 |100000

Up to 12 attachments (including images) can be used with a maximum of 23.8 MiB each and 47.7 MiB total.

4 Comments

·
Clair A avatar image
2 Likes"
Clair A commented Clair A edited

@Arun Kr I fully agree with you. I tried several times to convince the dev team to add such a chart template in the dashboard library.


In 2018:

Date: Mon, Aug 20, 2018 at 3:20 PM
Subject: Utilization per hour vs time
To: < [email protected]>
Hi,
In the last updates there have been many improvements to enrich the library of dashboard chart templates, like for example throughput per hour.
We still have quite often the question: is there a graph to display the utilization per hour of a resource versus time ? (or another intervall)
For example in the screenshot below, I displayed the average utilization of an AGV per hour. It's very valuable to identify utilization peaks throughout the day.

average-utilization-per-hour.png


In 2020:

Hello,

We still frequently get the question about how to get the hourly utilization of a resource (operator, processor...) versus time.
I had submitted this idea 2 years ago, see a screenshot of how this chart could look like in the email below.
Is there a plan to add such a graph in the library in a coming release ?

After I've been told by the dev team that they "don't get this request very often", I tried to prove them wrong by showing them that the same question was asked over and over on the forum:

November 2016, Patrick Cloutier, Canada: " How to record State Analysis Statistics every hour instead of globally"

April 2017, Michael O'Connell, United States: "Utilizations by discrete time periods"

https://answers.flexsim.com/questions/37904/utilizations-by-discrete-time-periods.html

January 2018, Anish G, United States: " How can I get utilization of a processor by hour? "
https://answers.flexsim.com/questions/47388/how-can-i-get-utilization-of-a-processor-by-hour.html

June 2018, Mason W, United States, " Collect Statistics by Time" with comment: "the main metrics would be operator utilization..."
https://answers.flexsim.com/questions/52054/collect-statistics-by-time.html

November 2018, wei-ting L, United States: " Pie State vs Time"
https://answers.flexsim.com/questions/58286/pie-state-vs-time-in-an-excel-table.html

June 2019, Trex, India: " How to get state stats of Task executer in a interval of time for defined period"
https://answers.flexsim.com/questions/67279/how-to-get-state-stats-of-task-executer-in-a-inter.html

December 2019, Javier Benitez, Mexico: " is there a way I could also track the utilization base on a interval time?", comment from this post:
https://answers.flexsim.com/questions/68436/how-to-get-dashboard-for-the-utilization-vs-time.html
So he asked a new question here: " How can I track the utilization of operators on different intervals of time?"

https://answers.flexsim.com/questions/75977/how-can-i-track-the-utilization-of-operators-on-di.html

We also have many times the same question in our tech support address in French, I translate some quotes below:

"I would like to add a dashboard which would give me the average AGV utilization for each hour"

"I have an issue with the operator statistics: I would need to get utilization states per hour"

"how to get an indicator showing the utilization percentage versus time"

...

Let's hope that the votes on this idea will escalate this feature in the dev list.

5 |100000

Up to 12 attachments (including images) can be used with a maximum of 23.8 MiB each and 47.7 MiB total.

Ana Madureira avatar image
1 Like"
Ana Madureira commented

Hello Arun! I agree. In fact I use it in every single model and the time it takes to set it up has gone down but is still considerable.

5 |100000

Up to 12 attachments (including images) can be used with a maximum of 23.8 MiB each and 47.7 MiB total.

Clair A avatar image
1 Like"
Clair A commented

I gave a training last week, and once again this performance indicator has been asked by the participants.

5 |100000

Up to 12 attachments (including images) can be used with a maximum of 23.8 MiB each and 47.7 MiB total.

Arun Kr avatar image
0 Likes"
Arun Kr commented

Requesting the developer team at FlexSim to give this feature a priority since this feature is being requested by many of our clients also.

@anthony.johnson @Jordan Johnson @Phil BoBo

Regards,

Arun KR

· 1
5 |100000

Up to 12 attachments (including images) can be used with a maximum of 23.8 MiB each and 47.7 MiB total.

Jordan Johnson avatar image Jordan Johnson ♦♦ commented ·
Good to know, I'll increase the priority of this issue. Thanks!
5 Likes 5 ·

Write a Comment

Up to 12 attachments (including images) can be used with a maximum of 23.8 MiB each and 47.7 MiB total.

Your Opinion Counts

Share your great idea, or help out by voting for other people's ideas.

Related Ideas